
A chromatography resin is the particulate stationary phase packed into a chromatographic bed: a base matrix, a defined particle size, an internal pore architecture and — in most binding modes — an immobilized functional ligand. Which of those four dominates depends on the separation mechanism the step is built on, not on which polymer the bead happens to be made from.
That is why resin selection begins with the mechanism rather than the catalogue. Agarose, dextran, methacrylate, polystyrene-divinylbenzene and silica each appear in more than one mode, and the choice between them is usually settled after the mechanism rather than before it — though not freely, since silica dissolves above about pH 8 and is ruled out wherever alkaline sanitization is required. This guide works through the four properties that define performance, compares the modes on the terms a process actually cares about — selectivity, usable capacity, mass transfer, pressure, recovery and cleanability — and ends with a selection workflow you can run against a real feed.
What is a chromatography resin?
A chromatography resin is a particulate stationary-phase material used in a packed bed, built on cross-linked polysaccharides, synthetic polymers, silica or composite structures. In ion-exchange, affinity, hydrophobic-interaction and mixed-mode chromatography a functional ligand provides the intended interaction with sample components; in size-exclusion chromatography there is deliberately no such ligand.1–4 A few media are the exception that proves the rule: ceramic hydroxyapatite, a widely used mixed-mode medium, has no immobilized ligand at all — its calcium and phosphate sites are the matrix itself.
The word carries a working-vocabulary caveat. “Resin” is standard in preparative and process biochromatography, but it is not a synonym for every chromatographic stationary phase. Membranes and monoliths perform related separations without being porous beads at all, and the transport arguments below do not transfer to them unchanged. Figure 1 shows how the four design variables sit together in a single bead.
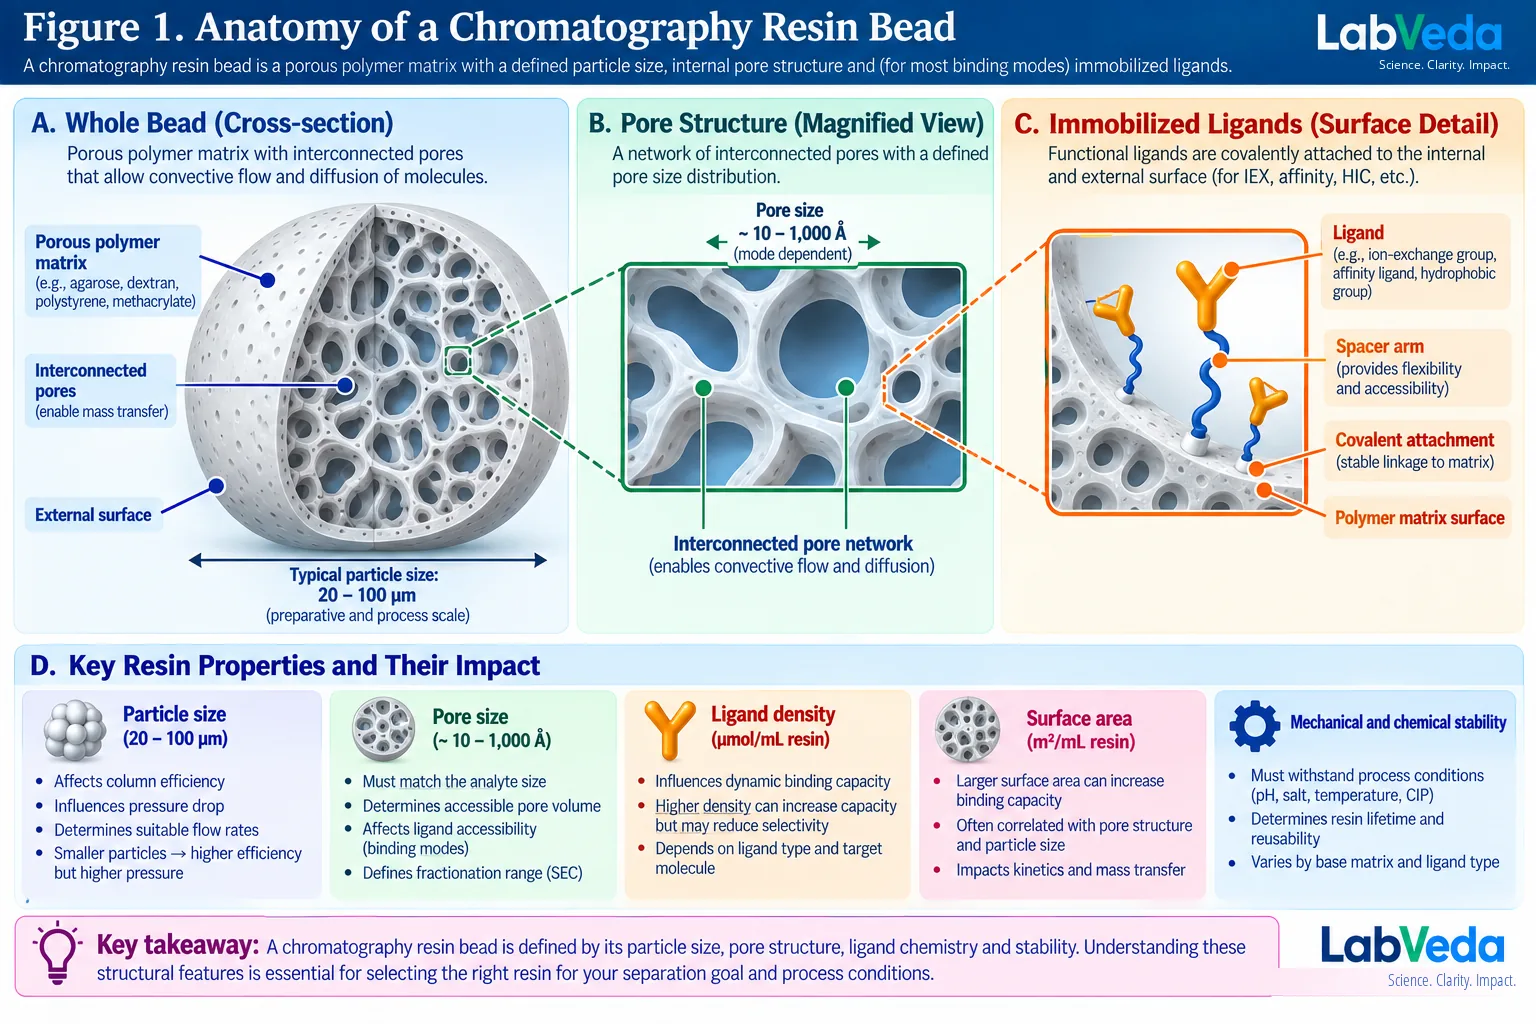
Which four properties decide how a chromatography resin performs?
Table 1 sets out the four properties and what each one actually controls. Matrix and pore architecture are fixed for a given product line, while particle size and ligand chemistry are commonly offered as variants within one platform — which is where most real selection happens.
| Property | What it is | What it governs |
|---|---|---|
| Base matrix | Cross-linked agarose, dextran, methacrylate and other synthetic polymers, polystyrene-divinylbenzene, silica, composites | Rigidity and swelling, allowable pressure and pressure–flow behavior, solvent and chemical compatibility, cleaning and sanitization tolerance, nonspecific interactions, and the surface available for ligand immobilization |
| Particle size, dp | External bead diameter, typically 20–100 µm for preparative and process media | Mass-transfer distance and column efficiency, hydraulic resistance and pressure drop, packing behavior and the practical bed geometry at scale |
| Pore architecture | Pore diameter, pore-size distribution, accessible pore volume, internal surface structure | In SEC, the fractionation range directly; in binding modes, analyte access to ligands, intraparticle transport and usable capacity |
| Ligand chemistry | Q and DEAE, SP and CM, phenyl and butyl, Protein A, immobilized metal chelates, mixed-mode ligands | The interaction mechanism and therefore the selectivity, together with the elution conditions and the chemical stability limits of the medium |
Particle size is not pore size
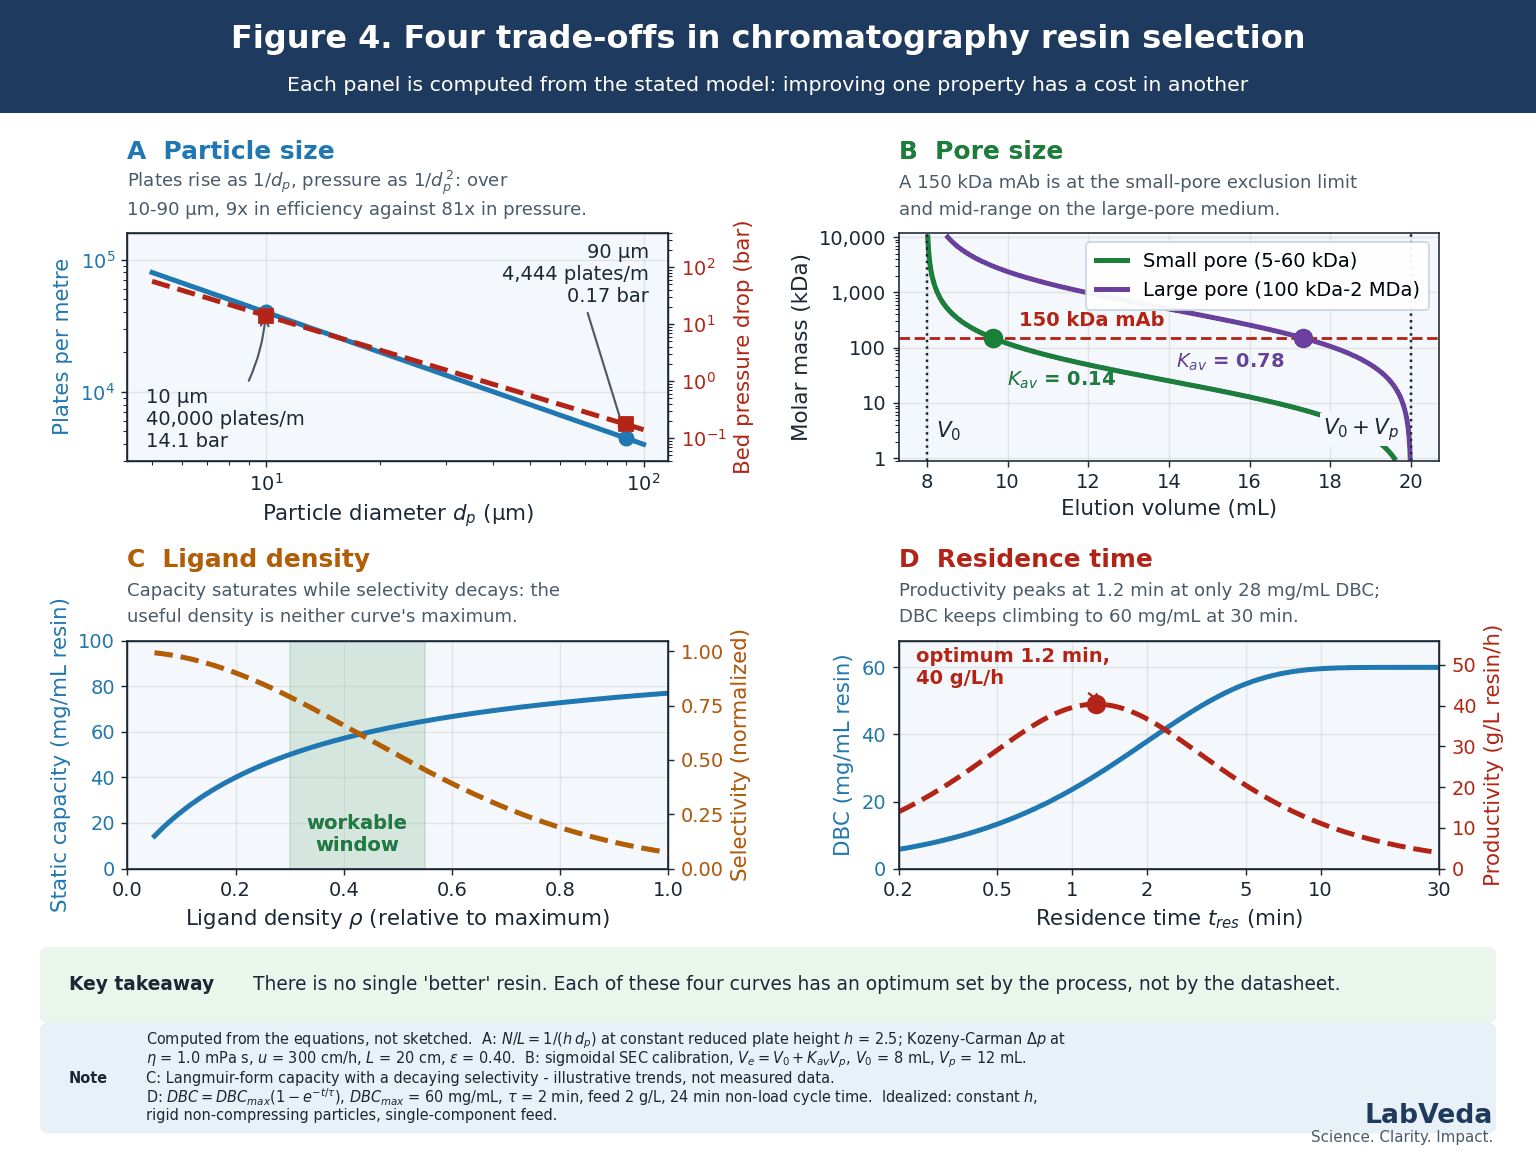
Smaller particles shorten mass-transfer distances and raise column efficiency, but they raise hydraulic resistance faster. As limiting cases, efficiency scales roughly as 1/dp at a constant reduced plate height while pressure drop follows the Kozeny–Carman 1/dp2 at a constant linear velocity, so across a 10 to 90 µm range — the 10 µm end being lab-scale rather than process-scale, and included to show the trend — the efficiency gain is about ninefold against a pressure penalty of about 81-fold. Those two idealizations assume different operating conditions and cannot both hold on one column — at genuinely fixed velocity the reduced plate height rises with particle size, so the real efficiency gain is smaller than ninefold — but the direction of the trade-off is robust, and it is why particle size is chosen against the system’s pressure limit rather than for efficiency alone. Smaller therefore does not mean better; the optimization is resolution against pressure, throughput, bed geometry and scale, and it is the same trade-off that drives high backpressure diagnosis on analytical systems.
Pore architecture does different work in different modes
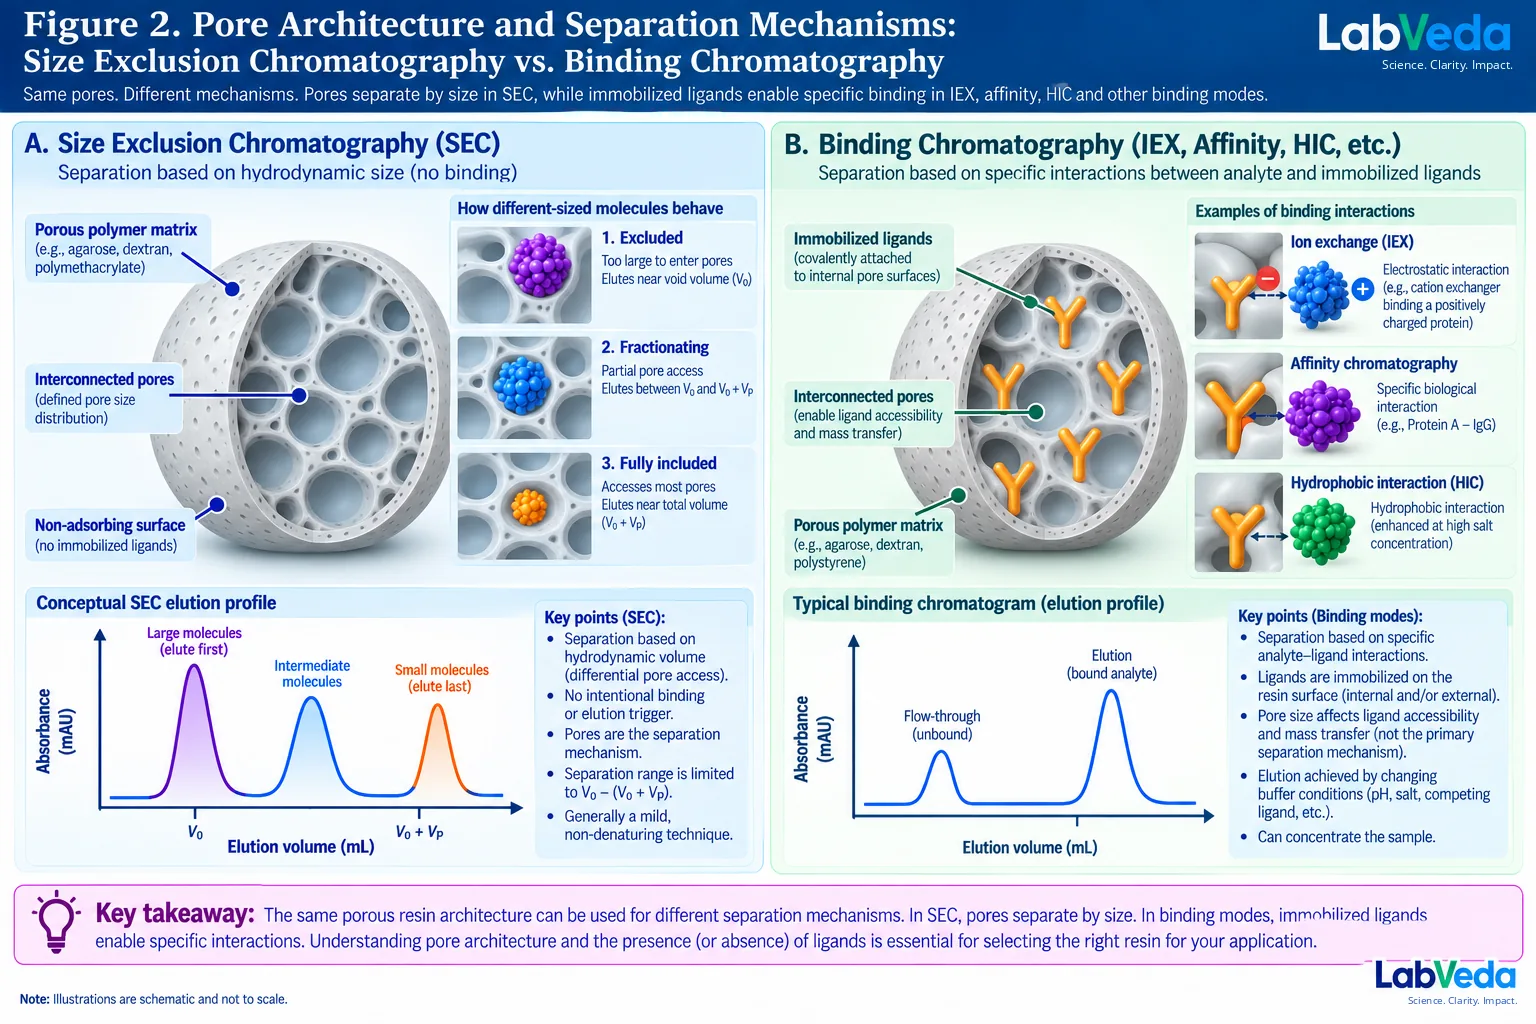
This is the distinction that most resin comparisons get wrong. Table 2 states the role explicitly by mode, and Figure 2 draws it.
| Mode | Primary role of pore architecture |
|---|---|
| SEC | Controls differential accessible pore volume and therefore the useful fractionation range — the separation mechanism itself |
| Ion exchange | Governs analyte access to charged ligands and intraparticle transport; selectivity comes from charge |
| Affinity | Governs access to the immobilized ligand and usable binding capacity; selectivity comes from recognition |
| HIC | Governs access to hydrophobic ligands and intraparticle transport; selectivity comes from surface hydrophobicity and mobile-phase conditions |
| Mixed-mode | Governs ligand accessibility; selectivity is still set primarily by multifunctional ligand chemistry and mobile-phase conditions |
How do chromatography resin types compare?
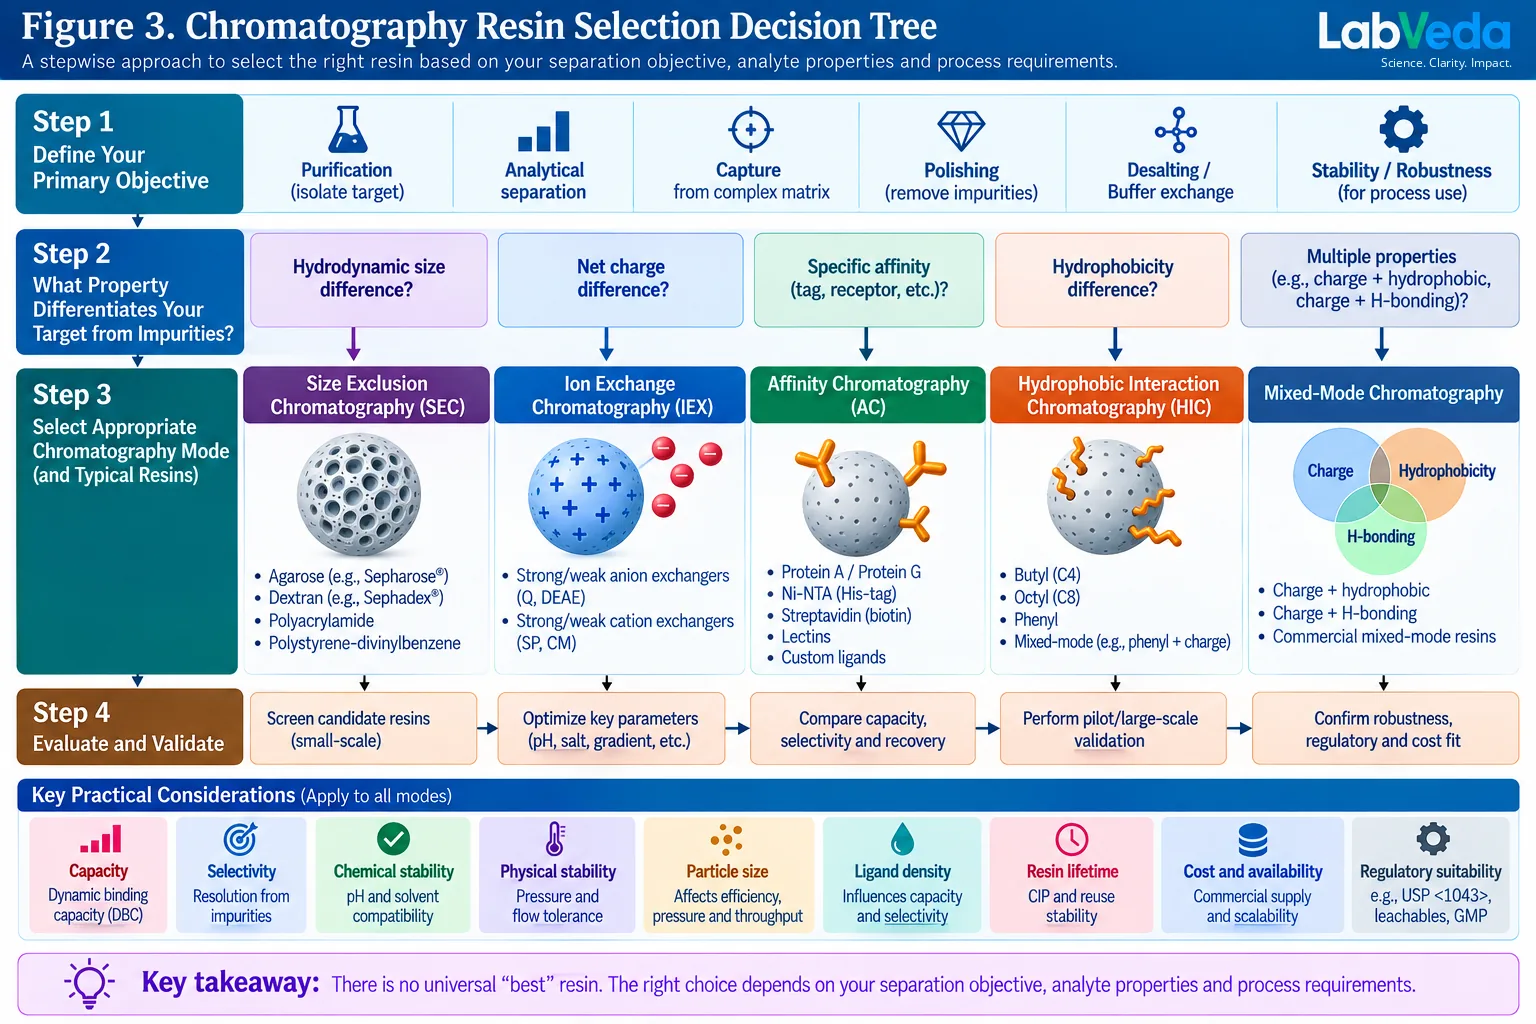
Table 3 compares the five mode families on the terms that decide a process step. Figure 3 turns the same logic into a decision path: identify the objective, then the molecular property that separates target from impurities, then screen against the process constraints.
| Mode | Primary selectivity | Loading and elution | Capacity and common role |
|---|---|---|---|
| Ion exchange (IEX) | Differences in ion-exchange affinity and surface charge | Bind at suitable pH and conductivity; elute by raising conductivity or changing pH | DBC matters; capture, intermediate and polishing |
| Affinity | Specific biological recognition between target and ligand | Bind under recognition-compatible conditions; elute by a ligand-specific disruption | Target-specific DBC; high-selectivity capture |
| HIC | Accessible hydrophobic surface | Bind at moderate to high salt; usually elute by decreasing salt | Strongly condition-dependent DBC; intermediate and polishing |
| SEC | Hydrodynamic volume and accessible pore volume | No intentional binding; isocratic mobile phase throughout | No binding-capacity concept; polishing, aggregate and fragment separation, desalting |
| Mixed-mode | Two or more simultaneous interactions | Chemistry-specific; elute with pH, salt and modifiers | Strongly condition-dependent; difficult selectivity problems and polishing |
Mixed-mode media are the one family the table cannot summarize in a phrase. Their ligands pair an ion-exchange group with a hydrophobic or hydrogen-bonding element, and the practical reason to reach for one is salt tolerance: a mixed-mode step can capture from a high-conductivity pool that an ion exchanger would refuse, which removes a dilution or buffer-exchange step from the train. The price is a much larger and less predictable design space, because pH, salt and modifier all move selectivity at once.
How do you choose between ion-exchange, affinity and HIC resins?
Ion exchange separates primarily by differences in ion-exchange affinity.1 Anion exchangers carry positively charged groups and bind negatively charged proteins; cation exchangers do the reverse. The relationship between working pH and the protein’s isoelectric point is the starting point — above the pI a protein tends to carry net negative charge, below it net positive — but it is not a complete retention model, because local charge patches, conformation, conductivity, competing impurities and ligand chemistry all modify binding. “Strong” and “weak” describe how the functional group’s ionization varies with pH, not a ranking of binding strength: Q and SP are strong, DEAE and CM weak. Exchanger and buffer selection is treated in full in the ion exchange chromatography guide.
Affinity chromatography exploits specific analyte–ligand recognition, which IUPAC defines in terms of the biological specificity of that interaction.2 Table 4 lists the common chemistries. High theoretical specificity is not the whole selection: an elution condition that damages the target, a ligand that loses performance under cleaning, or measurable ligand leakage will each cost more than the selectivity gained.
| Affinity chemistry | Recognition basis | Typical use |
|---|---|---|
| Protein A | Fc-region interaction | IgG and monoclonal antibody capture |
| Protein G | Immunoglobulin-binding domains | Antibody purification with different species and subclass selectivity |
| IMAC (pseudo-affinity) | Metal–histidine coordination — chemical rather than biological recognition | His-tagged recombinant proteins |
| Glutathione | GST–glutathione interaction | GST-tagged proteins |
| Strep systems | Engineered peptide–ligand interaction | Tagged recombinant proteins |
| Lectin | Carbohydrate recognition | Glycoproteins and glycoconjugates |
| Immunoaffinity | Antigen–antibody interaction | Highly selective target isolation |
HIC separates through interactions between hydrophobic patches on the analyte and hydrophobic ligands on the stationary phase. Binding is promoted at high salt and elution is usually achieved by decreasing salt concentration; ligand identity and ligand density both shift retention strength, as does the choice of salt.5 A high-salt pool leaving an upstream step can sometimes be loaded onto HIC without an intervening buffer exchange, but only when salt identity, concentration, pH, viscosity and target stability all fall inside the HIC binding window — which is a reason to track the chemical state of the pool leaving each operation, not an argument that the step is free.
Why does SEC need a different mental model from binding chromatography?
IUPAC defines size-exclusion chromatography as separation occurring mainly according to hydrodynamic volume, in a porous non-adsorbing material whose pores are of approximately the same size as the effective dimensions of the molecules in solution.4 There is no intentional binding and elution cycle; differential access to intraparticle pore volume is the whole mechanism. The consequences are covered in depth in the size exclusion chromatography principles guide, and three of them change how the medium is selected.
Excluded, fractionating and fully included species
Molecules too large to access meaningful pore volume elute near the interstitial volume V0, the liquid held between the beads. This is not the same quantity as the analytical column void volume, which is measured with an unretained small molecule that samples the pores as well and therefore corresponds to the total liquid volume, V0 + Vp — a distinction worth holding on to, because the two are routinely conflated. Molecules whose dimensions fall inside the useful pore-access range distribute through different fractions of the internal volume and can be separated. Very small molecules access most of the pore volume, and once two species are similarly fully included, size discrimination is weak. IUPAC defines the molar-mass exclusion limit as the maximum molar mass that can enter the pores in a given system; above it molecules are totally excluded and co-elute at the interstitial volume, so size discrimination is lost.6 Smaller pores therefore do not automatically give higher resolution — the pore-size distribution has to place the analytes inside a useful fractionation range in the first place, which is why SEC media are selected by fractionation range rather than by pore size alone.7
Sample volume, and why SEC sits late in a process
High-resolution SEC is unusually sensitive to the width of the loaded sample zone: excess sample volume adds band broadening and degrades resolution directly. Desalting and group separations tolerate a much larger sample fraction than aggregate–monomer separations because the objective is different, so a loading rule taken from a desalting column does not transfer to a high-resolution separation. Because the technique is volume-limited and dilutes rather than concentrates the product, SEC is normally positioned after a concentrating step such as affinity, IEX or HIC.8 This is also the clearest case of a more general rule: binding modes are constrained by usable capacity, breakthrough target, residence time and fouling, while high-resolution SEC is constrained by the starting zone, and loading logic does not carry between the two.
Secondary interactions
Ideal SEC assumes negligible adsorption. Real protein systems show ionic, hydrophobic and metal-mediated interactions that produce retention shifts, tailing, distorted apparent size and poor recovery. If an analyte elutes later than its size predicts, the first question is whether a non-size interaction is contributing, not whether the molecule is smaller than expected — the same diagnostic discipline set out in the peak tailing diagnostic path.
How should you compare dynamic binding capacity between resins?
Static binding capacity describes equilibrium uptake under batch conditions. Dynamic binding capacity is what a packed column delivers under flow, and it is the operationally relevant number. The common metric is QB10, the mass of target bound per unit resin volume at 10% breakthrough, determined from a breakthrough curve at a defined residence time.9 Because the value depends on the test protein, its concentration, pH, conductivity, the breakthrough criterion and the flow condition, a headline “80 mg/mL” is not superior to “60 mg/mL” until all of those are known and matched.
Residence time is the variable most often left out. Analytes must move from the flowing mobile phase into the accessible interior of the particle and reach the ligands, and that intraparticle diffusion takes time, so usable capacity rises with contact time before it plateaus. The bed residence time is simply:
tres = Vbed / Q
where Vbed is the packed-bed volume and Q the volumetric flow rate. Figure 4 shows why capacity alone is the wrong thing to maximize.
A worked example
Take a 500 mL bed run at 250 mL/min, so tres = 500/250 = 2.0 min. On the model in Figure 4D, DBC = 60 × (1 − e−1) = 60 × 0.632 = 37.9 mg/mL, which is 19.0 g of target on the column. From a 2 g/L feed that is 9.48 L, and at 250 mL/min the load takes 38 min. Halving the flow to 125 mL/min doubles tres to 4.0 min and raises DBC to 60 × (1 − e−2) = 51.9 mg/mL, a 37% gain — 26.0 g on the column, so 12.97 L of feed. But the load now takes 104 min, 2.7 times longer, because the extra capacity and the slower flow lengthen it together. The sharper point is where those two operating points sit on the productivity curve: on the model in Figure 4D both are already past its peak, the 2.0 min case yielding about 37 g/L/h and the 4.0 min case about 24 g/L/h. Capacity is still climbing while throughput is falling, which is exactly why the two cannot be optimized as one number.
What does a practical resin-selection workflow look like?
The sequence below runs the decision in Figure 3 against a specific feed. It is a screening order, not an optimization order.
- Define the objective. Capture, intermediate purification, polishing, aggregate removal, impurity depletion, desalting or buffer exchange — each implies a different balance of capacity, resolution and throughput.
- Identify the exploitable difference. Hydrodynamic volume → SEC; charge → IEX; specific recognition → affinity; hydrophobicity → HIC; no single sufficient property → mixed-mode or an orthogonal screen. Figure 3 runs the same branches in that order.
- Define the feed constraints. Target concentration and load volume, pH and conductivity, salt composition, viscosity and particulate burden, impurity burden, and target stability.
- Compare candidates under realistic conditions. Selectivity and recovery, DBC at a stated residence time, particle size and pore accessibility, pressure–flow behavior, chemical stability and cleaning tolerance. The same discipline that governs HPLC method development applies here: change one variable, and judge the experiment by the term it was meant to move.
- Evaluate lifecycle economics. Purchase price per liter is rarely the right metric. Cost per gram of purified product folds in usable capacity, cycle count, recovery, buffer and cleaning consumption, process time, labor and failure risk — and a more expensive resin that raises recovery, extends cycle life or removes a unit operation can lower both cost and environmental burden across the process.
How do cleaning and resin lifetime affect resin choice?
There is no universal cleaning recipe, and cleaning tolerance is a selection criterion rather than an afterthought. Sodium hydroxide is the workhorse for chromatography-resin sanitization, but ligand stability toward it varies sharply: conventional Protein A tolerates only mild alkaline cleaning, well below the concentrations routinely used on ion exchangers, and it was to lift that ceiling that alkali-stabilized ligand variants were engineered — in one case by a single amino-acid substitution in the C domain.10 Cycling studies on modern alkali-tolerant affinity media show how much lifetime that engineering buys, and equally how resin-specific the answer is.11 A cleaning-in-place protocol validated for one medium does not transfer to another.
In practice that means using the manufacturer’s validated cleaning and storage limits as the boundary, then tracking DBC, recovery and purity across cycles, monitoring pressure–flow behavior and packing integrity, trending ligand leakage and carryover where relevant, and investigating performance drift rather than retiring a column on cycle count alone.
How do you diagnose resin-related performance problems?
Table 5 maps the observations that recur in packed-bed operation onto their resin-related causes and the first thing to check.
| Observation | Likely resin-related causes | Check first |
|---|---|---|
| Early breakthrough | Insufficient DBC, residence time too short, wrong binding conditions | Breakthrough curve, residence time, pH and conductivity |
| Capacity falls across cycles | Fouling, ligand degradation, irreversible adsorption | DBC trend, CIP history, recovery |
| Pressure rises | Bed compression, fouling, precipitate, fines | Pressure–flow profile, frits, feed clarity |
| IEX target does not bind | Conductivity too high, wrong exchanger, unfavorable pH | pH, conductivity, target pI, exchanger type |
| HIC target does not bind | Salt insufficient or unsuitable, ligand too weakly hydrophobic | Salt identity and concentration, ligand screen |
| HIC target will not elute | Interaction too strong | Ligand hydrophobicity, salt gradient, compatible modifiers |
| SEC peak tails | Secondary interaction, overload, packing problem | Mobile phase, sample volume, matrix chemistry, asymmetry |
| SEC resolution falls | Excessive load, column deterioration, wrong fractionation range | Sample volume, pore selection, efficiency, packing |
| Product recovery falls | Irreversible adsorption, precipitation, degradation on the column | Mass balance across load, wash and elution |
What is changing in chromatography media design?
Useful innovation is better described by transport, stability and selectivity than by “high-performance” labelling. The active directions are mass-transfer-optimized pore architectures, smaller-particle preparative media, alkali-stable affinity ligands, multifunctional mixed-mode ligands, and non-bead formats. Membranes and monoliths are not resins, but their convective transport removes much of the intraparticle diffusional limitation that sets the residence-time behavior above12, which makes them attractive for very large biomolecules and for flow-through polishing where residence time would otherwise dominate the cycle.
Frequently asked questions
Does a smaller resin particle size always improve separation?
No. Smaller particles shorten the mass-transfer distance and raise efficiency, but hydraulic resistance rises faster than efficiency does — roughly as 1/dp2 against 1/dp. Across a 10 to 90 µm range that is a ninefold efficiency change against an 81-fold pressure change. The right particle size is the largest one that still meets the resolution the step needs, given the system’s pressure limit, the bed geometry and the throughput target. At process scale, bed compression and packing behavior constrain the choice further.
Does a smaller pore size mean better SEC resolution?
No, and this is one of the most persistent misconceptions in media selection. Pore size sets the fractionation range, not the resolution within it. If the analytes are larger than the exclusion limit they co-elute near the interstitial volume; if they are far smaller than the pores they are all fully included and again poorly separated. The medium has to place the species of interest inside the useful fractionation range. Only then does resolution depend on efficiency, sample volume and the difference in hydrodynamic volume.
What is the difference between particle size and pore size?
Particle size is the external diameter of the bead; pore size describes the internal void architecture inside it. They are independent design variables and a specification for one tells you nothing about the other. In SEC, pore size determines which molecular-size range the medium can fractionate, while particle size affects efficiency and pressure. In binding modes, pore architecture governs ligand accessibility and intraparticle transport, while particle size governs mass-transfer distance and hydraulic resistance.
Should I compare resins on static or dynamic binding capacity?
Dynamic binding capacity, for any packed-column operation. Static capacity describes equilibrium uptake in batch and systematically overstates what a column delivers under flow. But DBC is only comparable when the test protein, feed concentration, pH, conductivity, breakthrough criterion and residence time are all stated and matched between the resins being compared. A capacity figure without those conditions is not a specification you can act on.
Why does dynamic binding capacity change with flow rate?
Changing the flow rate changes the bed residence time, tres = Vbed/Q. Analytes need time to diffuse from the flowing phase into the accessible interior of the particle and reach the ligands there, so a shorter residence time means less of the internal capacity is reached before breakthrough. The effect is largest for large, slowly diffusing molecules and for media with restrictive pore architecture. This is why any quoted DBC has to name the residence time it was measured at.
Why is SEC usually placed late in a purification process?
Two reasons, both structural. High-resolution SEC is volume-limited: the loaded sample zone is part of the separation, so load volume is typically a small percentage of the column volume rather than the multiples of column volume a binding step can accept. And SEC dilutes the product rather than concentrating it. Both properties make it a poor capture step and a good polishing step, run after affinity, IEX or HIC has already reduced volume and concentrated the target.
Can SEC show nonspecific retention?
Yes. Ideal SEC assumes a non-adsorbing matrix, but real protein systems show ionic, hydrophobic and metal-mediated interactions with the medium. These produce retention shifts, peak tailing, distorted apparent molecular size and reduced recovery. The practical consequence is that a later-than-expected elution should not be read as a smaller molecule until non-size interactions have been excluded, usually by adjusting ionic strength or mobile-phase composition and seeing whether the retention moves.
Can every chromatography resin be cleaned with sodium hydroxide?
No. NaOH tolerance is specific to the matrix and the ligand. Robust ion-exchange media on synthetic matrices commonly tolerate aggressive alkaline cleaning, whereas conventional Protein A tolerates only mild alkaline cleaning, which is why alkali-stabilized ligand variants exist. Always work inside the manufacturer’s validated cleaning and storage limits for the specific medium, and treat a protocol validated on one resin as inapplicable to another until it has been demonstrated.
The takeaway
Resin selection is a mechanism decision before it is a material decision: identify the property that separates your target from its impurities, choose the mode that exploits it, and only then compare media. The four properties that define a resin — matrix, particle size, pore architecture and ligand chemistry — do not carry equal weight across modes, and the single most common error is treating pore size as if it meant the same thing in size exclusion as in binding chromatography. In SEC the pores are the separation; everywhere else they are the route to the ligand. Capacity figures deserve the same scepticism: a dynamic binding capacity without its residence time, feed and breakthrough criterion is not comparable to another, and maximizing capacity alone will cost throughput. The resin that wins is the one that delivers the required selectivity, recovery, productivity and lifetime under the conditions the process actually runs at.
References
- IUPAC, “ion-exchange chromatography”, Compendium of Chemical Terminology (the “Gold Book”), online version, DOI 10.1351/goldbook.I03168.
- IUPAC, “affinity chromatography”, Compendium of Chemical Terminology (the “Gold Book”), online version, DOI 10.1351/goldbook.A00177.
- IUPAC, “hydrophobic-interaction chromatography”, Compendium of Chemical Terminology (the “Gold Book”), online version, DOI 10.1351/goldbook.09891.
- IUPAC, “size-exclusion chromatography (SEC)”, Compendium of Chemical Terminology (the “Gold Book”), online version, DOI 10.1351/goldbook.S05705.
- R. Ewonde Ewonde, N. Lingg, D. Eßer and S. Eeltink, “A protocol for setting-up robust hydrophobic interaction chromatography targeting the analysis of intact proteins and monoclonal antibodies”, Anal. Sci. Adv. 3(11–12), 304–312 (2022).
- IUPAC, “molar-mass exclusion limit”, Compendium of Chemical Terminology (the “Gold Book”), online version, DOI 10.1351/goldbook.M03978.
- P. Hong, S. Koza and E. S. P. Bouvier, “A review size-exclusion chromatography for the analysis of protein biotherapeutics and their aggregates”, J. Liq. Chromatogr. Relat. Technol. 35(20), 2923–2950 (2012).
- C. Ó’Fágáin, P. M. Cummins and B. F. O’Connor, “Gel-filtration chromatography”, in Protein Chromatography, Methods in Molecular Biology vol. 681, 25–33, Humana Press (2011).
- J. W. Beattie, R. C. Rowland-Jones, M. Farys, H. Bettany, D. Hilton, S. G. Kazarian and B. Byrne, “Application of Raman spectroscopy to dynamic binding capacity analysis”, Appl. Spectrosc. 77(12), 1393–1400 (2023).
- K. Minakuchi, D. Murata, Y. Okubo, Y. Nakano and S. Yoshida, “Remarkable alkaline stability of an engineered protein A as immunoglobulin affinity ligand: C domain having only one amino acid substitution”, Protein Sci. 22(9), 1230–1238 (2013).
- S. Serban, Y. Li, G. Li, T. Gu, L. Liu, X. Lei, C. Tinsley, X. Kou and A. Basso, “Engineering enhanced alkaline stability of recombinant protein A for improved monoclonal antibody affinity purification in industrial applications”, Purification 2(2), 4 (2026).
- Y. Li, H. Zhou and S. Gu, “Advantages of Protein A membrane chromatography: high productivity, strong impurity removal capability, and more”, Membranes 16(7), 222 (2026).
Further reading
- G. Carta and A. Jungbauer, Protein Chromatography: Process Development and Scale-Up, Wiley-VCH (2010), DOI 10.1002/9783527630158 — the standard reference for adsorption isotherms, breakthrough behavior and scale-up.
- C. Ó’Fágáin, P. M. Cummins and B. F. O’Connor (eds.), Protein Chromatography: Methods and Protocols, Methods in Molecular Biology, Humana Press — practical method-level treatment of each mode (see ref. 8 for the gel-filtration chapter).
- IUPAC, Compendium of Chemical Terminology (the “Gold Book”) — the authority for the mode definitions used throughout this page.
Reviewed against primary sources. Every definition, mechanism and threshold on this page is checked against the IUPAC Gold Book entries for the four chromatography modes and against the primary literature cited above. Numerical examples are illustrative calculations from the equations stated and are not method-development predictions or acceptance criteria. For validated or compendial methods, the applicable procedure and regulatory framework take precedence over the general rules of thumb given here. Evidence review: September 2026.