Peak tailing is one of the most common complaints in HPLC — and one of the most misdiagnosed. A tailing peak inflates integration error, degrades resolution, and can quietly fail a system suitability requirement. But “my peaks are tailing” isn’t a diagnosis; it’s a starting point. The same asymmetric peak can come from silanol interactions, column overload, a void at the column head, extra-column volume, or a detector setting.
This guide gives you a single organizing question that sorts most tailing problems into the right half of the decision tree, then walks through the specific causes and a diagnostic flow you can actually follow.
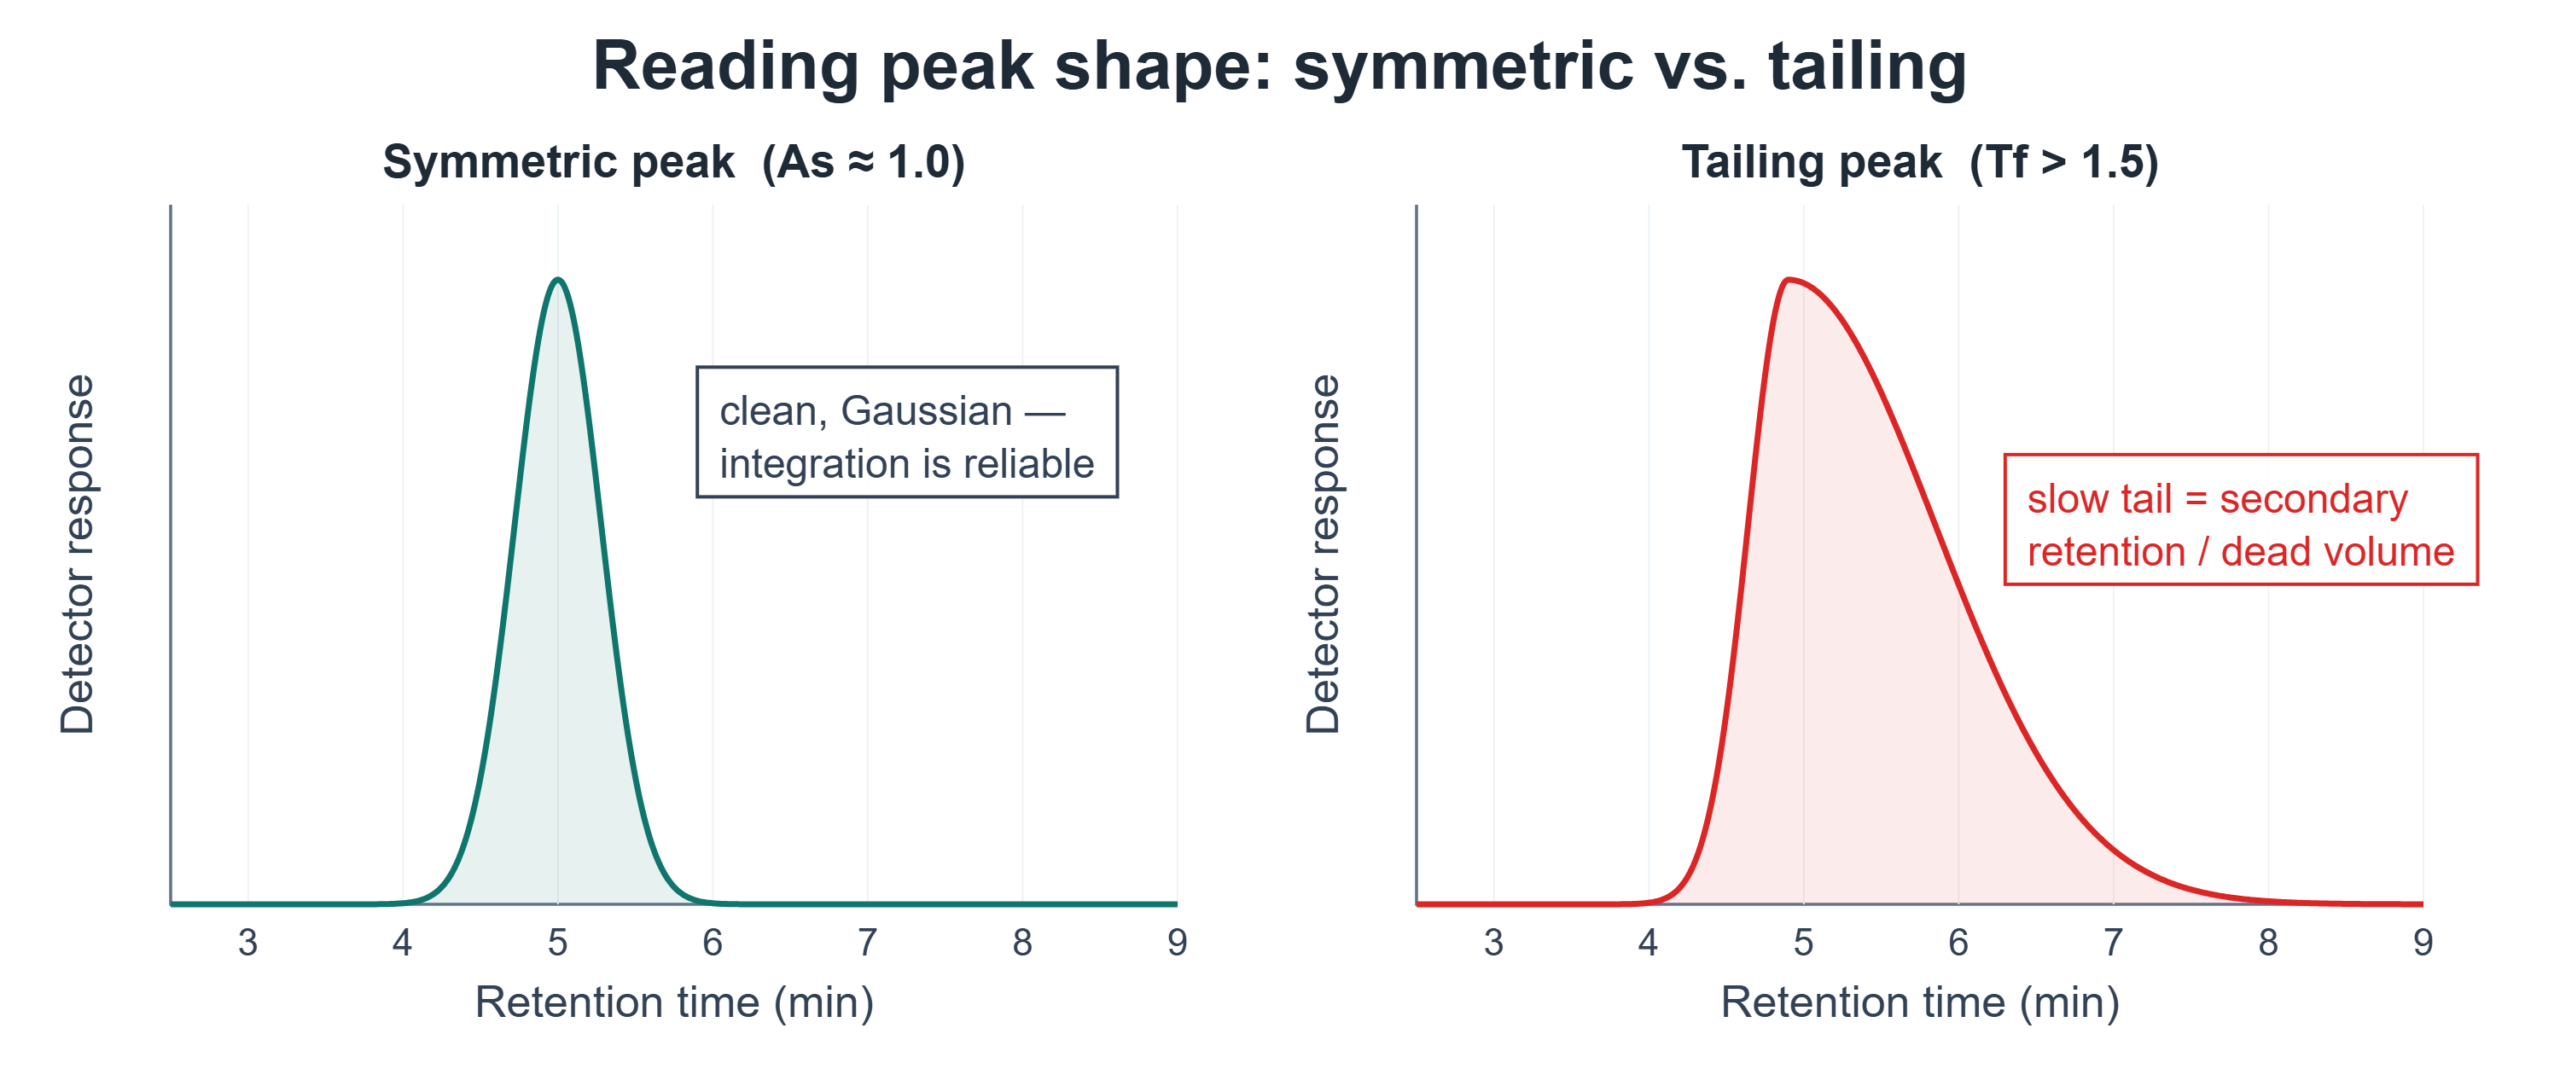
Quick definition first: tailing is quantified by two related metrics — the USP tailing factor (Tf), measured at 5% of peak height, and the asymmetry factor (As), measured at 10%. Both compare the back half of the peak to the front half. A perfectly symmetric peak gives a value near 1.0; most methods flag a tailing factor above roughly 1.5 as a problem worth investigating.
Tailing is only one kind of peak-shape problem — if you’re also seeing fronting or split peaks, start with our broader guide to poor HPLC peak shapes and come back here for the deep dive on tailing.
The one question that sorts everything: selective or universal?
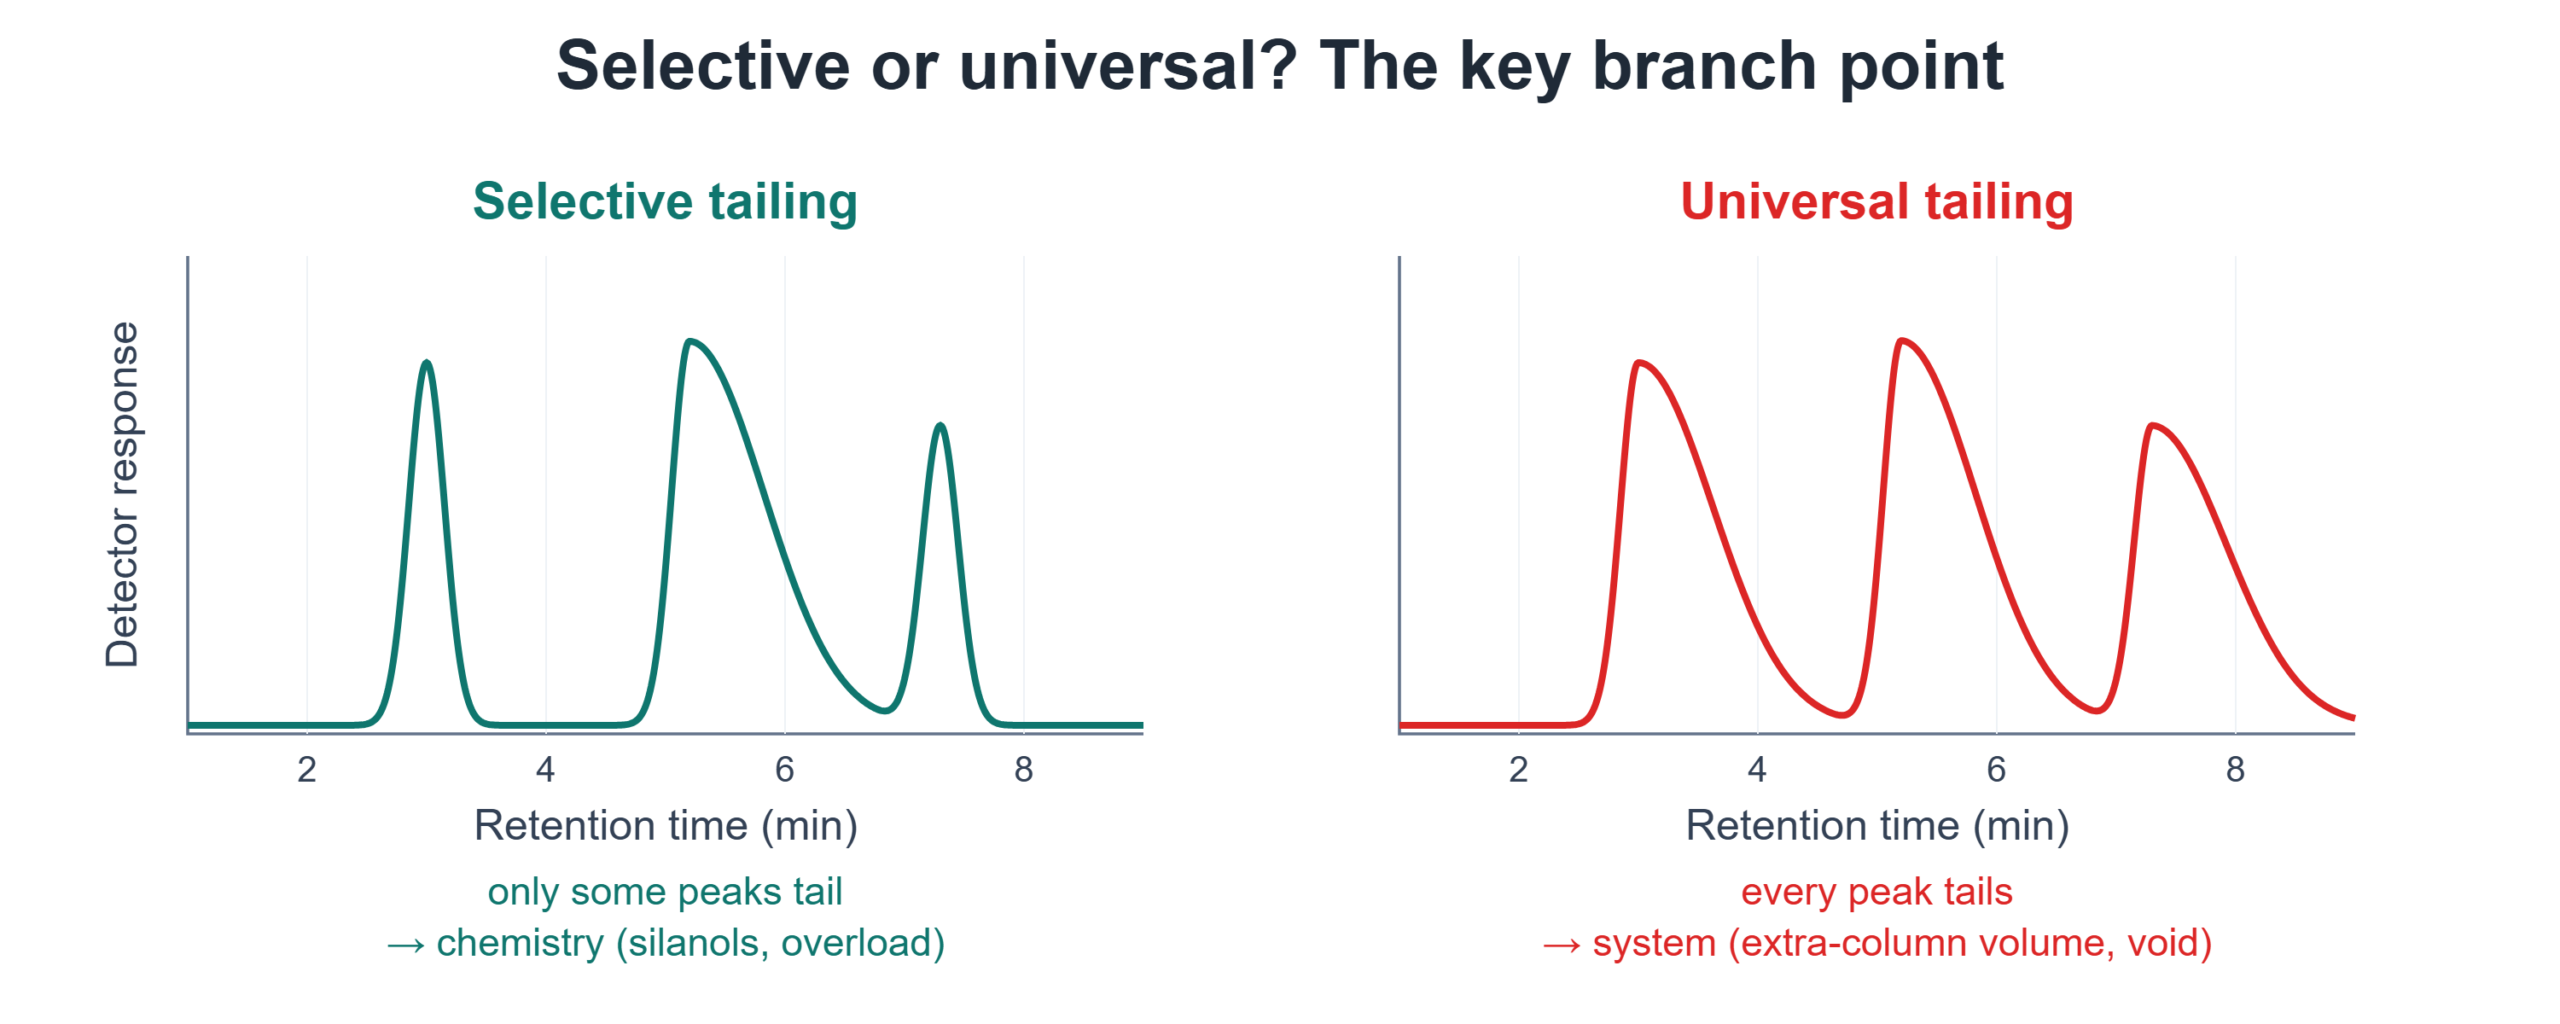
Before anything else, look at whether the tailing is selective (only certain analytes tail while others in the same run are sharp) or universal (every peak tails, roughly in proportion).
- Selective tailing points to chemistry — the tailing analyte is interacting with the column in a way others aren’t. Think silanol interactions with basic compounds, or overload of one component.
- Universal tailing points to the system — a physical problem that broadens every band regardless of its chemistry. Think extra-column volume, a column void, or detector/data-rate settings.
This single branch point saves enormous time, because it tells you whether to investigate mobile phase and column chemistry or hardware and configuration.
Cause 1: Silanol interactions (basic analytes)
The most common chemical cause. Residual acidic silanol groups on silica-based stationary phases interact with basic analytes through a secondary, slower retention mechanism layered on top of the intended one. The result is a characteristic tail on basic compounds while neutral and acidic peaks stay sharp — a textbook selective-tailing pattern.
Fixes: work at a mobile phase pH that suppresses the interaction, add a competing base or appropriate additive, or move to a column specifically end-capped or designed for basic compounds. If only your amines tail, this is almost always the cause.
Cause 2: Column overload
Inject too much mass of an analyte and you exceed the linear capacity of the stationary phase. The excess can’t partition normally, and the peak distorts — usually fronting for concentration overload, but tailing patterns appear too, and the peak shape is load-dependent. The tell: the distortion improves when you dilute the sample and re-inject. If a peak sharpens on dilution, you were overloaded.
Cause 3: Column void at the head
Over time, or after pressure shocks or aggressive pH, the packed bed can settle and leave a small void at the column head. Bands entering that void partially remix before re-focusing, broadening and tailing peaks — often universally, since every band passes through the same void. A confirmed head void isn’t repairable in practice; the column should be retired. Prevention is the better lever: stay within the column’s recommended pH range and avoid pressure shocks.
Cause 4: Extra-column volume
Every dead volume between the injector and the detector — oversized connecting tubing, poorly seated fittings, an unswept union — lets the separated band re-mix and spread before it reaches the flow cell. This broadens and tails peaks, and it hits early-eluting, low-retention peaks hardest. If your first peaks tail badly but later peaks are sharper, suspect extra-column volume.
The fix is mechanical discipline: use the shortest possible run of narrow-bore connecting tubing, ensure fittings are correctly seated with matched ferrules, and eliminate unnecessary unions. This matters far more on modern low-dispersion UHPLC systems and small-volume columns.
Cause 5: Sample solvent mismatch
If your sample is dissolved in a solvent stronger than the mobile phase — for example, injecting a sample in pure acetonitrile into a mostly-aqueous mobile phase — the sample band partially elutes before it focuses on the column head. The result is fronting, tailing, or split peaks, again most visible on early peaks. Whenever possible, dissolve samples in the starting mobile phase or something weaker. If you must use a strong diluent, keep the injection volume small.
Cause 6: Detector and data-rate settings
Sharp, fast-eluting peaks need a high enough data acquisition rate to be reconstructed accurately; too slow a rate distorts the peak shape. An overly long detector response time (filter/time constant) smooths and tails peaks. If your tailing appeared after a method transfer or instrument change with no chemistry difference, check that the data rate gives you at least ~20 points across each peak and that the response-time setting matches your peak widths.
A diagnostic flow you can actually follow
- Look at the pattern. All peaks tailing → systemic (extra-column volume, void, detector). Only certain analytes → chemical (silanols, overload).
- Dilute and re-inject. Improves with dilution → overload. No change → not overload.
- Check the diluent. Stronger than mobile phase → fix the sample solvent.
- For basic analytes, test a lower pH or a column designed for bases.
- Inspect the hardware — fittings, tubing length, data rate — if the pattern is systemic.
- If a head void is confirmed, retire the column.
The takeaway
Tailing is rarely random. The most informative move you can make is also the simplest: notice whether the tailing is selective or universal. Selective tailing points to chemistry — usually silanol interactions or overload — and is fixable through mobile phase, column choice, or load. Universal tailing points to the system — extra-column volume, a column void, or detector settings — and is fixable through hardware and configuration. Working from that one branch point turns a vague “my peaks look bad” into a targeted fix.
Related troubleshooting guides: High backpressure in HPLC and Ghost peaks in HPLC.
Want a structured walkthrough for your specific peak-shape problem? Explore LabVeda’s chromatography troubleshooting tools for guided diagnostics built for working analysts.