
A distorted peak is not just a cosmetic problem — it is the chromatogram telling you something specific about the column, the sample or the plumbing. The shape itself narrows the cause faster than any other single observation, so the first job is always to name it correctly.
This page is the starting point for any peak shape problem. Identify the shape, use the table to shortlist causes, then work through the section for that shape.
Start here: which shape are you looking at? Table 1 maps each symptom to its likely causes, and Figure 1 shows what they look like.
| Shape | What you see | Most likely causes | First thing to try |
|---|---|---|---|
| Tailing | Slow return to baseline on the trailing edge | Silanol or metal interactions, void, extra-column volume, overload | Check pH and column chemistry |
| Fronting | Leading edge slopes out, sharp back edge | Mass overload, collapsed bed, injection solvent too strong | Halve the injection amount |
| Splitting | One peak becomes two, or a notched top | Blocked frit, void at column head, injection solvent mismatch, co-elution | Check whether all peaks split or just one |
| Broadening | Wide, low peaks; efficiency drops | Extra-column volume, slow detector response, ageing column, large injection | Check tubing ID and detector time constant |
| Shoulder | Bump on one side of the peak | Partial co-elution, early-stage splitting | Change selectivity |

Poor peak shapes come from four places: the sample, the stationary phase, the mobile phase, and the system hardware. Metal in the mobile phase, sample or stainless steel frits can cause tailing or fronting. Voids from an improper connection lead to tailing, splitting or fronting. Sample overloading has similar effects. Reactive sites on the stationary phase cause tailing, and a collapsed column bed causes fronting.
Put a number on it
Before and after any change, measure rather than eyeball:
Two numbers are used, and they are measured at different peak heights — which is the detail most often got wrong.
USP tailing factor (T)1, measured at 5% of peak height:
T = W0.05 ÷ 2f
Asymmetry factor (As), measured at 10% of peak height:
As = b ÷ a
| Term | Measured at | What it is |
|---|---|---|
| W0.05 | 5% height | The total width of the peak, front edge to back edge |
| f | 5% height | Distance from the front edge to the peak maximum — the front half only |
| a | 10% height | Distance from the front edge to the peak maximum |
| b | 10% height | Distance from the peak maximum to the back edge |
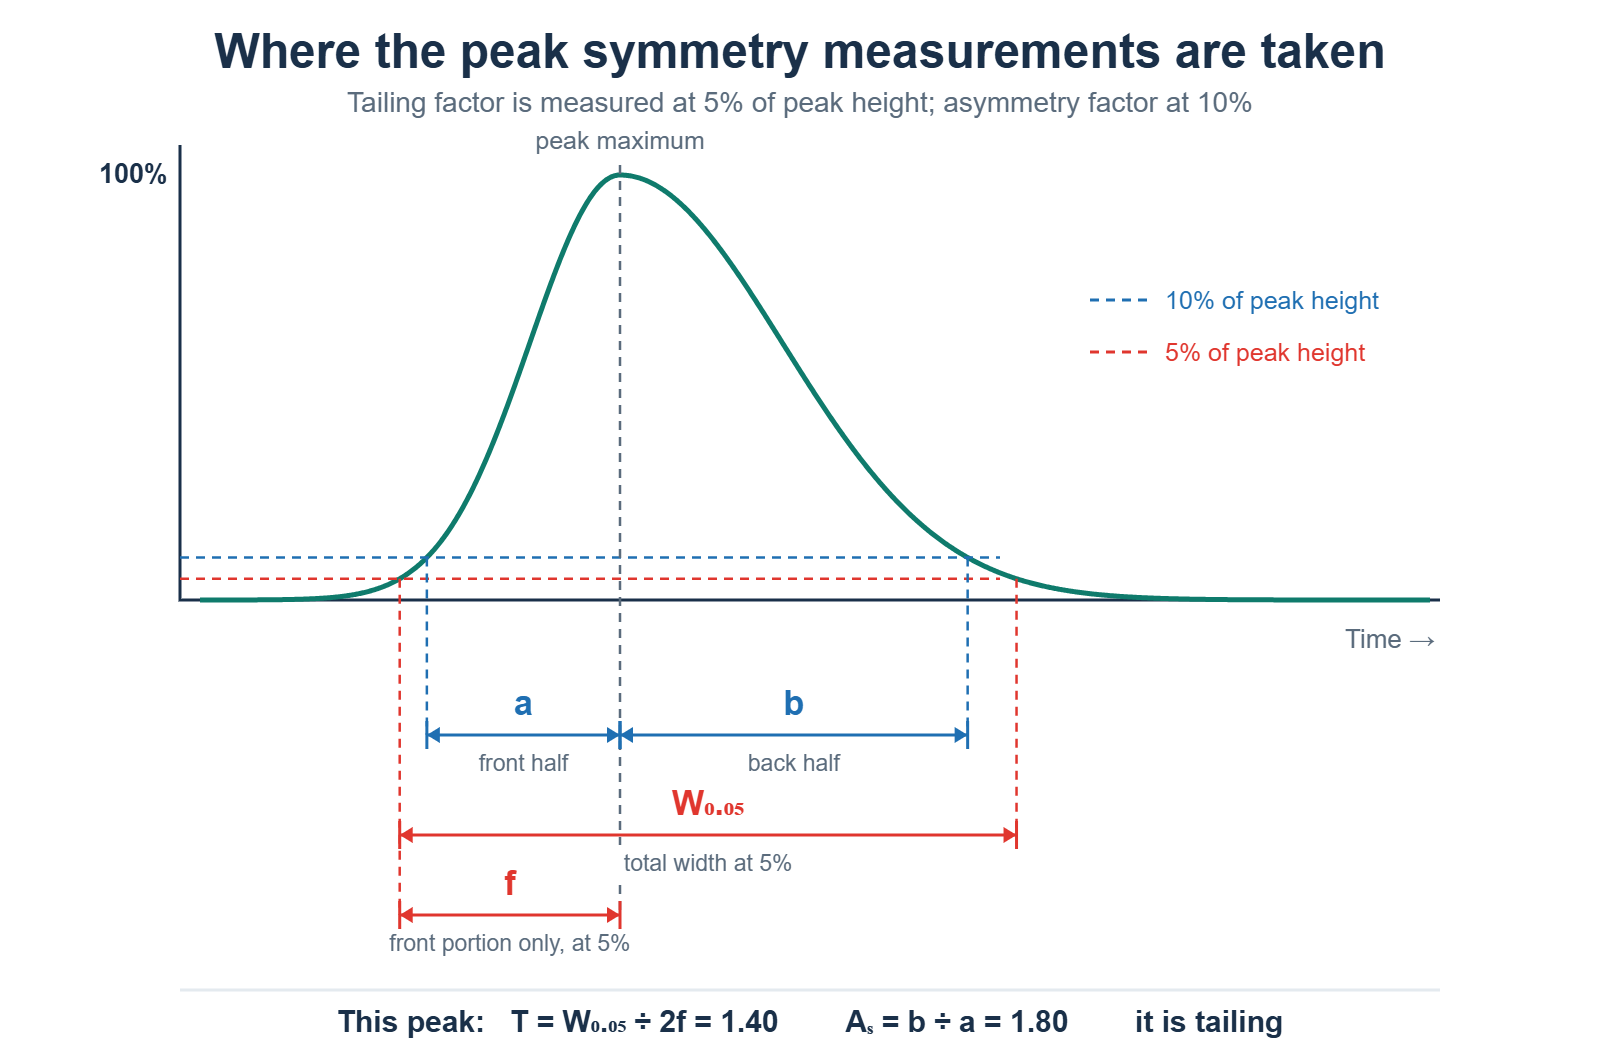
Both equations do the same thing in different ways: they compare the back of the peak with the front. In the tailing factor, 2f is what the total width would be if the peak were symmetrical, so dividing the real width by it shows how far off symmetry you are. In the asymmetry factor the comparison is direct — back half divided by front half. Table 2 defines each term in those equations, and Figure 2 shows where each measurement is taken on the peak.
T = 1.0 is perfectly symmetrical. Above 1.0 is tailing, below 1.0 is fronting. Most methods accept T ≤ 2.0. Recording the number each time turns “it looks a bit better” into evidence.
Peak Tailing Troubleshooter
Distinguish silanol effects, column overload, extra-column volume, and injection-solvent mismatch — systematically, in under ten questions.
Peak splitting
Splitting is the largest single peak-shape complaint, and it is also the one where a single question cuts the diagnosis in half:
Do all the peaks split, or only one?
All peaks split → the problem is physical. Something in the flow path is dividing the band before separation happens.
Only one peak splits → the problem is chemical. The other peaks are fine, so the column and plumbing are fine.
When every peak splits
Partially blocked inlet frit. Particulates from unfiltered samples or precipitated buffer collect on the frit and force the band through uneven channels. This is the most common cause. Reverse-flushing the column off-detector can clear it if the manufacturer permits, but prevention is better: filter samples through 0.2 µm, filter mobile phases, and always run a guard column.
A void or channel at the column head. Pressure shocks, bed settling, or dissolution of silica at high pH leave a cavity where the band spreads unevenly. Unlike a blocked frit, a void cannot be flushed out — the column needs replacing. Suspect this if splitting appeared suddenly after a pressure spike or a period of high-pH use.
Injection solvent stronger than the mobile phase. If the sample is dissolved in a solvent with more organic content than the starting mobile phase, the sample plug travels ahead of the band before focusing. This characteristically affects early-eluting peaks worst, and the fix costs nothing: dissolve the sample in the mobile phase or weaker, or cut the injection volume.
A poorly cut or badly seated fitting. A tubing end that is not square, or a ferrule set at the wrong depth, creates a small void that splits the band. Re-make the connection with a proper tubing cutter.
When only one peak splits
That is co-elution — two compounds sitting almost on top of each other, resolving just enough to notch the top. No amount of hardware work will fix it, because nothing is broken. Change the selectivity: switch organic modifier (methanol ↔ acetonitrile), adjust mobile phase pH, change column chemistry, or alter temperature. Small selectivity changes often separate what a gradient adjustment cannot.
Peak fronting
Fronting is less discussed than tailing but nearly as common, and it has a much shorter list of causes.
Mass overload. By far the most likely explanation. Too much analyte saturates the stationary phase locally, so the excess travels faster and the peak leans forward. The diagnostic is quick and definitive: halve the injected amount. If the shape improves, it was overload. Dilute the sample or reduce the injection volume — not the flow rate.
Collapsed or voided column bed. A settled bed leaves a gap at the inlet and distorts every peak, usually with rising backpressure alongside. Replace the column.
Injection solvent effects. As with splitting, a sample solvent stronger than the mobile phase can distort the front of the peak. Match the sample diluent to the mobile phase.
Temperature mismatch. Injecting cold sample onto a heated column — or the reverse — creates a thermal gradient across the band. Pre-heat the mobile phase before the column inlet if the flow rate is high.
Fronting and splitting often share a root cause, because both can come from a void or a solvent mismatch. If you see both together, treat it as a column or injection-solvent problem rather than two separate faults.
Peak tailing
Tailing has the longest cause list of any peak shape, so it has its own detailed guide — see why your HPLC peaks are tailing for the full diagnostic path.
In brief, the main causes are:
- Secondary silanol interactions — basic analytes interacting with residual silanols. Use a modern endcapped, high-purity silica column, work at lower pH, or add a competing base.
- Metal chelation — chelating analytes (phosphates, catechols) binding to metal in frits or tubing. Passivate the system or move to bio-inert hardware.
- Extra-column volume — oversized tubing, poorly made connections, or a large detector flow cell.
- Overload — tailing as well as fronting can come from injecting too much.
- Mobile phase pH near the analyte pKa — partial ionisation broadens and tails the peak. Work at least 2 pH units away from the pKa.
Peak broadening
Broad peaks lose resolution and sensitivity without necessarily looking distorted.
- Extra-column band broadening — tubing internal diameter too large or runs too long between injector, column and detector. Use the narrowest practical ID and the shortest possible lengths, especially on UHPLC.
- Detector response too slow — a long time constant smooths noise but also flattens peaks. Speed up the response and increase the data collection rate.
- Ageing column — efficiency falls gradually with use. Track plate count on a standard so decline is visible before it becomes a problem.
- Injection volume too large — the injected band is wide before separation begins.
- Low temperature — slow mass transfer broadens peaks; raising column temperature often sharpens them.
A systematic workflow
When several things could be responsible, change one variable at a time and work from cheapest to most disruptive; Figure 3 sets out the full route.
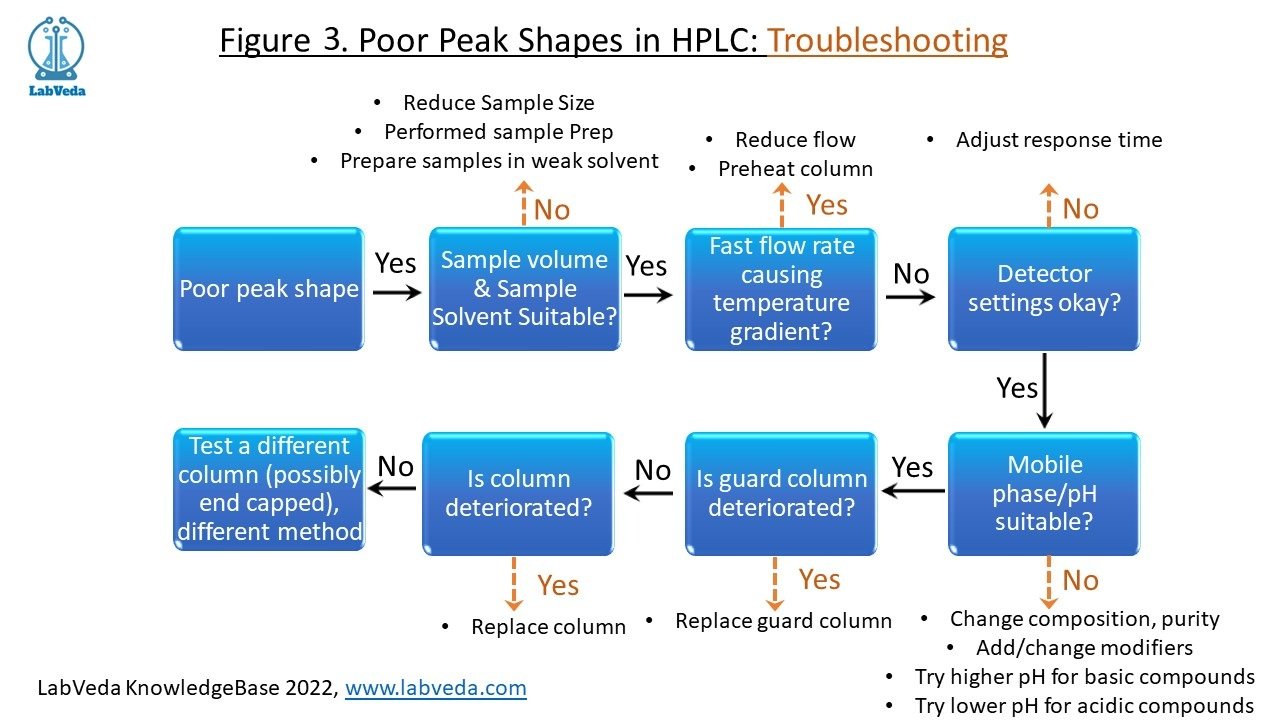
- Sample. Test a smaller injection and a weaker diluent. These are free, fast, and resolve overload and solvent-mismatch problems — a large share of all peak shape complaints. If the matrix is interfering, consider filtration, dilution or SPE (solid phase extraction).
- Injection and temperature. Reduce injection volume; pre-heat the mobile phase if the flow rate is high enough to create a thermal gradient across the column.
- Detector settings. A slower response setting reduces noise but broadens peaks. Check that the time constant and data rate suit the peak widths you are measuring.
- Mobile phase. Composition and quality both matter. Acid modifiers such as TFA, formic acid or acetic acid can transform peak shape for ionisable analytes. Keep the mobile phase free of metal contamination and confirm the pH is well away from analyte pKa values.
- Column and guard. Rinse per the manufacturer’s protocol — see HPLC column cleaning — and replace the guard column, which is cheap and often the actual culprit. An endcapped column reduces analyte–stationary phase interactions.
- The method itself. If nothing above works, the method may be wrong for the analyte rather than the system being faulty.
Clean the column, or replace it?
Cleaning is worth trying when backpressure has risen gradually, the problem affects all peaks, and the column has had a reasonable but not excessive number of injections. Follow the manufacturer’s solvent sequence.
Replace it when there is a void or collapsed bed (splitting or fronting that cleaning does not touch), when plate count has fallen substantially against its original value, or when the column has been run outside its pH or temperature specification. A void is mechanical damage — no solvent will fill it back in.
Sensible column care extends the interval between replacements; see HPLC column care and maintenance.
Related problems
If the peak shape is fine but something else is wrong:
- Ghost peaks in HPLC — peaks appearing where nothing was injected
- High backpressure in HPLC — often the same blocked frit that causes splitting
- Autosampler carryover — small peaks repeating in blanks
- Drifting retention times — shape is fine, position moves
- Baseline noise and drift — the baseline rather than the peak
Frequently asked questions
What causes peak splitting in HPLC?
Most often a partially blocked inlet frit or a void at the column head, which split every peak. If only one peak splits, it is co-elution of two compounds and needs a selectivity change, not a hardware fix.
How do I improve peak shape in HPLC?
Start with the cheapest tests: inject less, and dissolve the sample in mobile phase or weaker. Then check mobile phase pH and modifier, then detector response, then the column.
What causes peak fronting in HPLC?
Usually column overload. Halve the injection amount — if the shape improves, that was it. Otherwise suspect a collapsed bed or a sample solvent stronger than the mobile phase.
What is an acceptable tailing factor?
A tailing factor of 2.0 or below is a common acceptance criterion, measured at 5% of peak height1; the limit is set by your individual monograph or validated method, not by a universal compendial rule. A value of 1.0 is perfectly symmetrical.
Why do only my early peaks split?
That is the signature of an injection solvent stronger than the mobile phase. Later peaks have time to refocus; early ones do not.
Can a guard column cause poor peak shape?
Yes. A contaminated or voided guard column distorts peaks exactly as the analytical column would. It is cheap to replace, so change it before condemning the main column.
The takeaway
Name the shape first — tailing, fronting, splitting or broadening — because each points at a different part of the system. For splitting, ask whether all peaks or only one are affected: all means physical, one means chemical. For fronting, halve the injection before touching anything else. Measure the tailing factor before and after each change so you are working from numbers rather than impressions, and change one variable at a time, cheapest first.
Sources
- United States Pharmacopeia — General Chapter ⟨621⟩ Chromatography — the official definition of the tailing (symmetry) factor and how it is measured. Acceptance criteria are set by individual monographs and validated methods, not by the general chapter
Peak symmetry terminology on this page follows USP ⟨621⟩: the tailing factor is measured at 5% of peak height, while the asymmetry factor used by many data systems is measured at 10%. The two are not interchangeable.
Really good information,
Upload to gc trouble shoot also.
Yes, thank you for your suggestion. We will add it soon.