
The separation factor α is the ratio of the retention factors of two adjacent peaks, α = k2/k1 = (tR2 − tM)/(tR1 − tM), with the peaks numbered so that α is greater than 1. It measures how differently two compounds are retained by the column and mobile phase. It says nothing about peak width, so a large α is not the same as good resolution, and a change that moves both peaks later without changing α has not separated them.1,2
Retention factor k describes one analyte: how long it spends on the stationary phase relative to the hold-up time. Separation factor compares two analytes, and so answers a different method-development question: are the two compounds responding differently enough to the chromatographic system to be pulled apart? When k1 and k2 are nearly equal, α is close to 1 and no amount of extra retention will fix the pair; only a change in the chemistry that alters the two retention factors unequally will. This page gives the definition and the arithmetic, shows why α has more leverage on resolution than any other term, and lists the variables that change it in reversed-phase HPLC.
See also: the fundamental principle of chromatography, the parent guide this selectivity page sits under.
Chromatography Troubleshooting Decision Engine
Any HPLC symptom, one starting point — the engine narrows hundreds of failure modes to the few that fit your evidence.
How do you calculate separation factor in HPLC?
For two adjacent peaks, with peak 2 the more strongly retained:
α = k2 / k1
Because each retention factor is k = (tR − tM)/tM, the common hold-up time in the denominator cancels and α can be written directly from retention times:
α = (tR2 − tM) / (tR1 − tM) = t′R2 / t′R1
where tR1 and tR2 are the retention times of the two peaks, tM is the hold-up time (the retention time of an unretained compound) and t′R = tR − tM is the adjusted retention time. IUPAC defines α in exactly this way and adds that it equals the ratio of the two distribution constants, because the phase ratio is the same for both compounds; for mixed-mode retention the constants are effective ones.1 The calculation therefore needs adjusted retention, not the ratio of total retention times: tR2/tR1 includes tM in both numerator and denominator and is always closer to 1 than the true α.2,3 How to obtain each retention factor, and what its value means on its own, is covered in the HPLC retention factor guide.
Worked example: α from three retention times
An isocratic separation gives tM = 1.00 min, tR1 = 5.00 min and tR2 = 5.40 min. Table 1 carries the intermediate values.
| Quantity | Peak 1 | Peak 2 |
|---|---|---|
| Retention time, tR | 5.00 min | 5.40 min |
| Adjusted retention time, t′R = tR − tM | 4.00 min | 4.40 min |
| Retention factor, k = t′R/tM | 4.00 | 4.40 |
α = 4.40 / 4.00 = 1.10
The second compound has a retention factor 10% greater than the first under these conditions. Had the ratio of total retention times been used instead, 5.40/5.00 = 1.08 would have understated the relative retention. That unadjusted ratio is a legitimate quantity in its own right, the relative retention time used for peak identification in compendial monographs, but it is not the separation factor and must not be substituted for α.4 Note also that α = 1.10 does not by itself establish that the pair meets any resolution or system-suitability requirement; that depends on the plate number and the peak widths as well.
Because tM enters both adjusted retention times, an error in tM propagates into α: overestimating the hold-up time inflates α, underestimating it deflates it. Measuring the hold-up time from a genuinely unretained marker, and understanding its relation to the column volume, is described in the column void volume guide.3
Is it separation factor or selectivity factor?
Chromatographers use “selectivity”, “selectivity factor” and “separation factor” interchangeably for α. The IUPAC Gold Book entry for the quantity is “separation factor”, and it notes that the alternative term “selectivity” is discouraged for this quantity.1 The reason is that “selectivity” already has a formal meaning in analytical chemistry: the extent to which other substances interfere with the determination of a substance by a given procedure, a property of the whole method rather than of one pair of peaks.5
LabVeda uses “separation factor” for the quantity α and “selectivity” for the chromatographic behavior it measures: a change of stationary phase that alters α is a selectivity change, and the term (α − 1)/α in the resolution relationship is the selectivity term. Both words appear on this page because both are entrenched in the method-development literature.6 Some older texts also write α as the “relative retention” r; the 1993 IUPAC recommendations reserve relative retention for the adjusted retention of a component relative to a chosen reference compound under identical conditions, and separation factor for the ratio of two adjacent peaks ordered so that α is greater than unity.2
Why does increasing retention not separate a critical pair?
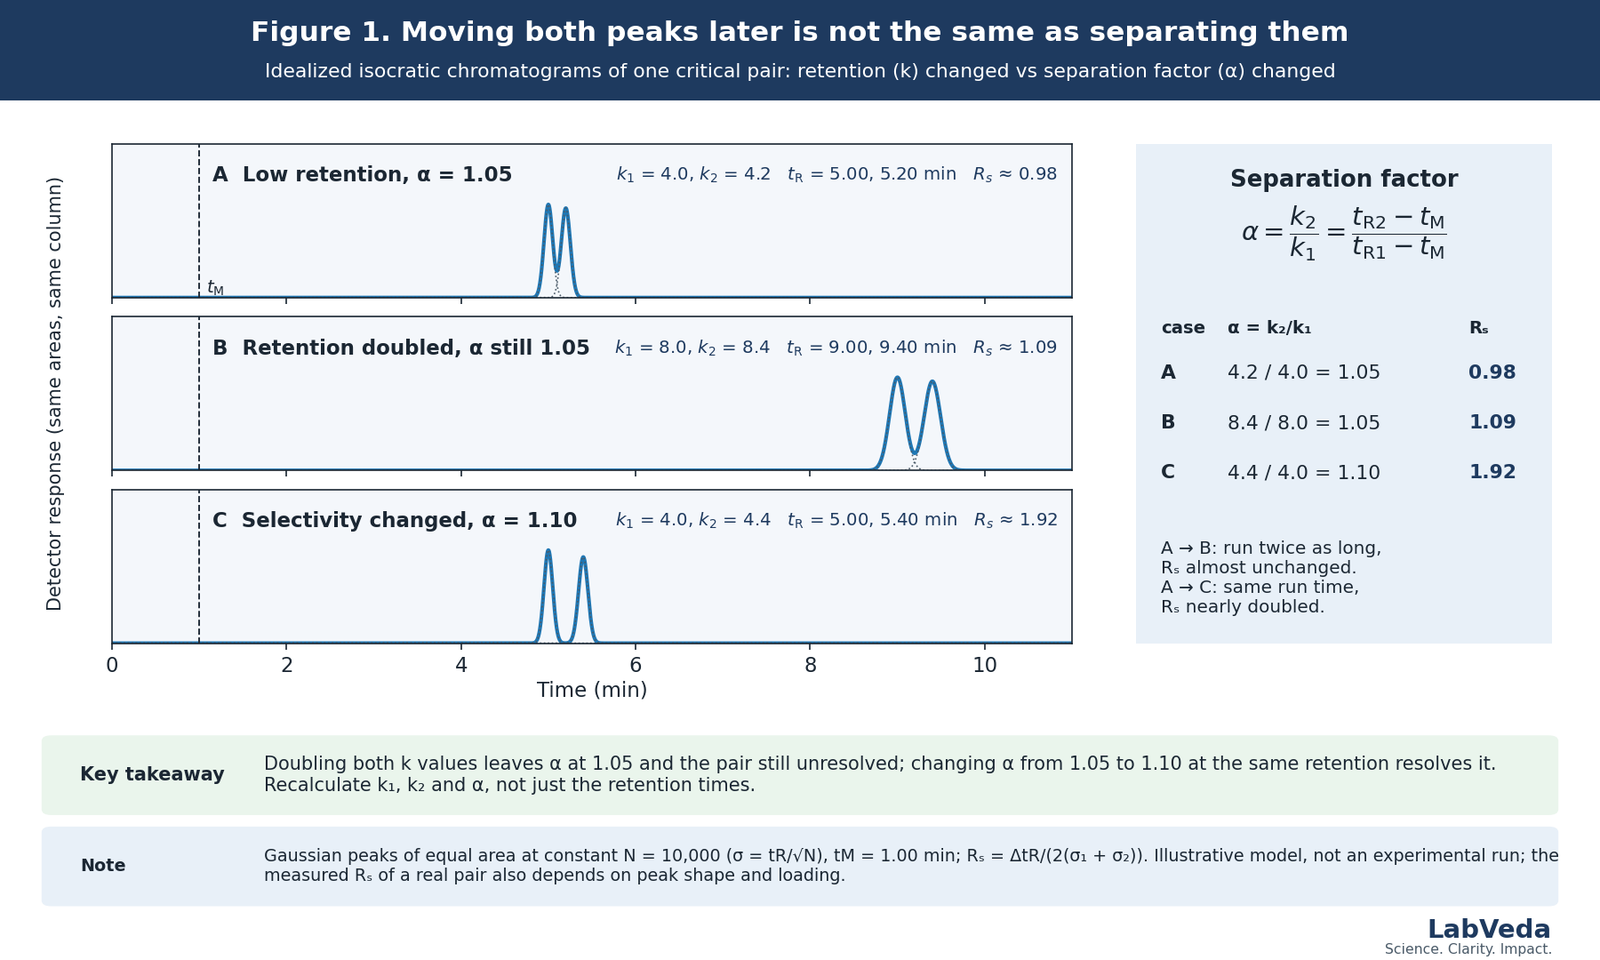
Consider a pair with k1 = 4.0 and k2 = 4.2, so α = 1.05. Weakening the mobile phase roughly doubles both retention factors to 8.0 and 8.4; α is still 1.05. The chromatogram is nearly twice as long, the peaks are nearly twice as wide, and the pair is essentially as unresolved as before: its resolution Rs, the distance between the two peaks relative to their widths, barely changes. Figure 1 shows this pair under three conditions on the same column: the two at α = 1.05 and a third in which the second retention factor alone is raised to 4.4, so that α = 1.10 at essentially the original run time. Doubling the retention leaves the pair overlapped; the selectivity change resolves it. The next section evaluates the same three cases with the resolution relationship.
Why does separation factor have so much leverage on HPLC resolution?
The approximate resolution relationship for isocratic separations factors Rs into an efficiency term, a selectivity term and a retention term. In the Purnell form, evaluated for the second peak of the pair:7,8
Rs ≈ (√N / 4) × ((α − 1) / α) × (k2 / (1 + k2))
where N is the plate number, α the separation factor and k2 the retention factor of the second peak. The form assumes Gaussian peaks of equal width. Snyder, Kirkland and Dolan write the equivalent relationship with (α − 1) in place of (α − 1)/α and the mean k of the pair; the two forms agree closely near α = 1 and differ only in how a given selectivity change is expressed.3 The version used here is the one set out in the HPLC resolution guide. The point of interest is the selectivity term, (α − 1)/α, tabulated in Table 2 and plotted in Figure 2.
| α | Δα from row above | (α − 1)/α | Gain over the row above |
|---|---|---|---|
| 1.01 | — | 0.0099 | — |
| 1.02 | 0.01 | 0.0196 | +98% |
| 1.05 | 0.03 | 0.0476 | +143% |
| 1.10 | 0.05 | 0.0909 | +91% |
| 1.20 | 0.10 | 0.1667 | +83% |
| 1.50 | 0.30 | 0.3333 | +100% |
| 2.00 | 0.50 | 0.5000 | +50% |
Close to α = 1 the term is almost proportional to (α − 1), so a small absolute change in relative retention is a large relative change in the term: moving α from 1.05 to 1.10 raises it from 0.0476 to 0.0909, an increase of 91% (in the (α − 1) form the same step is +100%). The other two terms cannot do this. The efficiency term grows only as √N, so matching that 91% by efficiency alone would need N to rise by a factor of 1.91² ≈ 3.65, which for a given particle size means about 3.6 times the column length, run time and pressure. The retention term k2/(1 + k2) is already 0.8 at k2 = 4 and can never exceed 1, so it has at most 25% left to give.3
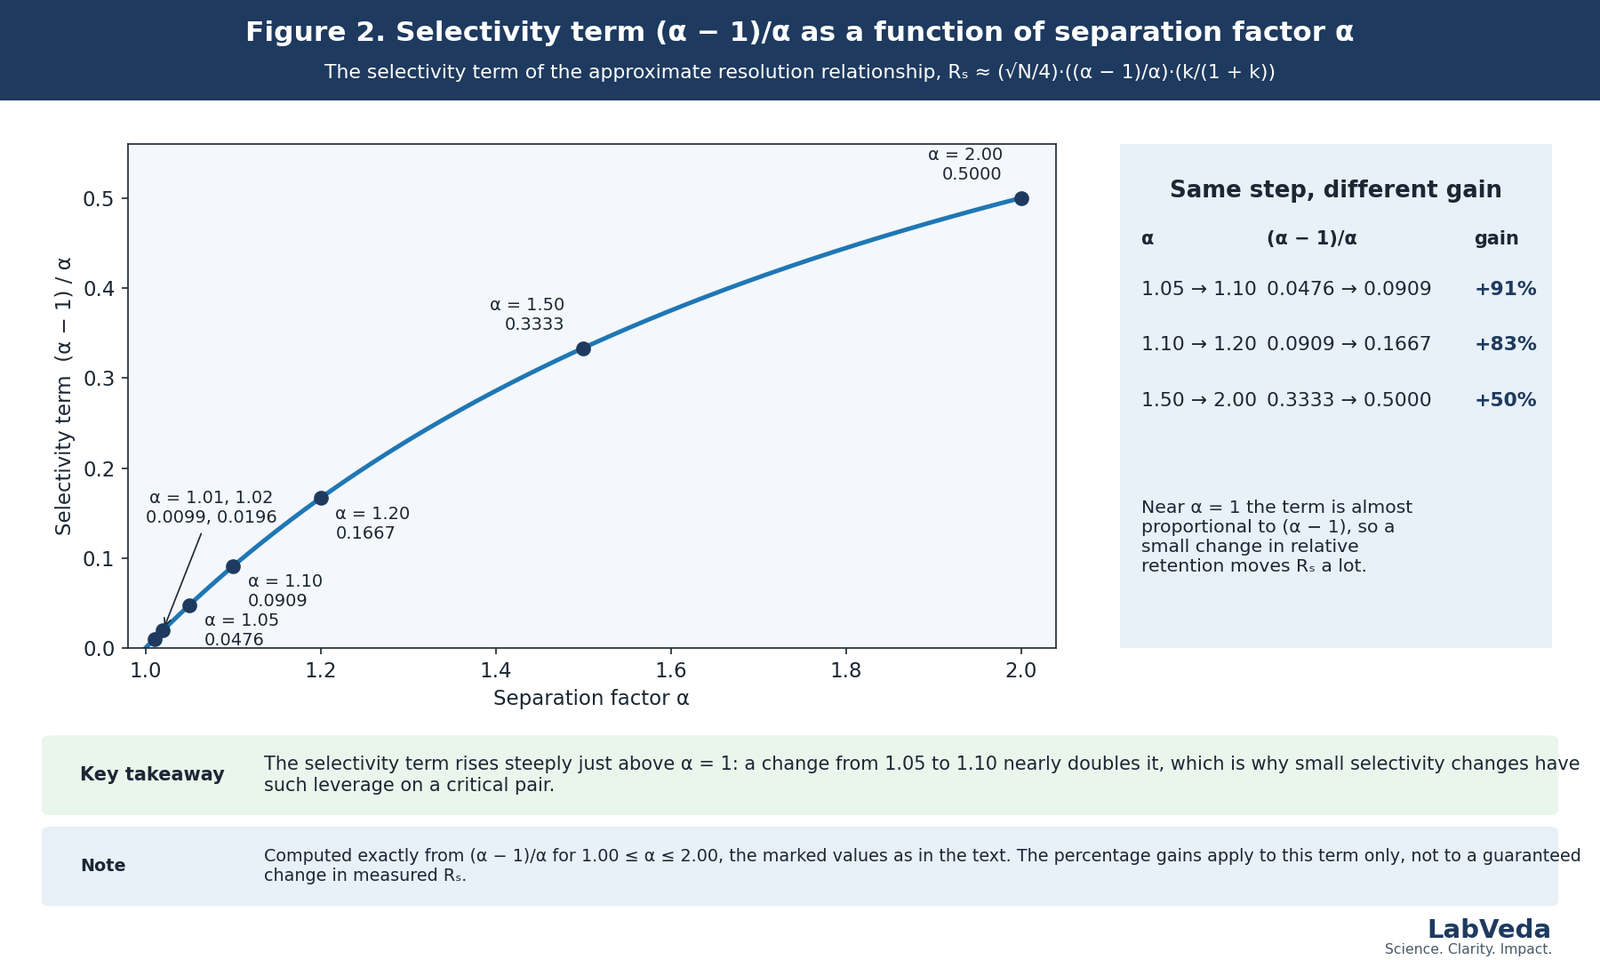
Table 3 returns to the three cases of Figure 1 and evaluates each with the relationship.
| Case | k1, k2 | tR1, tR2 (min) | α | (α − 1)/α | k2/(1 + k2) | Rs (equation) |
|---|---|---|---|---|---|---|
| A, low retention | 4.0, 4.2 | 5.00, 5.20 | 1.05 | 0.0476 | 0.808 | 0.96 |
| B, retention doubled | 8.0, 8.4 | 9.00, 9.40 | 1.05 | 0.0476 | 0.894 | 1.06 |
| C, selectivity changed | 4.0, 4.4 | 5.00, 5.40 | 1.10 | 0.0909 | 0.815 | 1.85 |
From A to B the run time nearly doubles and Rs moves from 0.96 to 1.06, entirely through the small rise in the retention term. From A to C the run time is unchanged and Rs nearly doubles to 1.85. (The Gaussian construction in Figure 1 gives 0.98, 1.09 and 1.92, slightly above the equation because the first peak of each pair is narrower than the second.) The lesson for a method-development experiment is that it should not be judged by whether the peaks moved: recalculate k1, k2, α and Rs for the critical pair after every change. A useful selectivity experiment is one that shifts the two analytes unequally, in the direction that improves the critical separation.6
Is there a good separation factor value?
No single α threshold guarantees an acceptable separation. Any α greater than 1 means the two compounds are retained differently, but whether that difference becomes baseline resolution depends on the plate number, the retention factor, the peak widths and asymmetry, the sample load and the requirement of the method. A pair with α = 1.03 reaches Rs ≈ 1.5 given about 60,000 plates at k ≈ 5; a pair with α = 1.10 still presents as a shoulder on a short, low-efficiency column (N ≈ 2,000 and k ≈ 1 give Rs ≈ 0.5), and tailing makes it worse. Rules such as “α above 1.1 is always adequate” should be avoided.3
Where a method is validated or compendial, the acceptance criteria are set in terms of measured quantities, usually resolution and tailing factor for named pairs, not in terms of α. USP General Chapter ⟨621⟩ defines both the adjusted relative retention and the unadjusted relative retention time tR2/tR1 used for peak identification in monographs, and sets no general limit on either.4 For validated or compendial methods, the applicable procedure and regulatory framework take precedence over the general rules of thumb given here.
How do you change separation factor in reversed-phase HPLC?
Selectivity depends on the chemistry of the analytes, the stationary phase and the mobile phase together, so there is no universal lever. Snyder (1997) and Snyder and Dolan (2013) reviewed the experimental variables that change relative retention in reversed-phase HPLC and ranked them by how large and how general their effect is, concluding that the best choice depends on the analyte chemistry, the constraints of the method and the robustness required.6,9 Table 4 summarizes the six variables, the mechanism through which each changes α, and the analytes for which it has the most leverage. The role each plays in a scouting sequence is treated at method level in how to develop an HPLC method.
| Variable | How it changes α | Largest effect for | Working notes |
|---|---|---|---|
| Stationary-phase chemistry | Shifts the balance of hydrophobic, steric, hydrogen-bonding and ion-exchange interactions; nominally identical bonded phases differ in ligand density, end-capping, silica type and silanol activity | Neutral structural analogs; any pair when the mobile phase is constrained | A C18-to-C18 swap is a selectivity experiment, not a brand change. The hydrophobic-subtraction model quantifies the differences,10 has been applied to type-B alkyl-silica columns,11 and is used to pick equivalent or deliberately “orthogonal” columns12 |
| Mobile-phase pH | Changes the degree of ionization, and so retention by a large factor, differently for compounds with different pKa values; interacts with modifier, buffer, temperature and stationary phase | Ionizable analytes; often the strongest single variable | As a working rule keep a robust method at least 1.5–2 pH units from an analyte pKa, where retention changes steeply with small pH errors; the pKa shifts in a hydro-organic mobile phase, and the method pH is normally that of the aqueous buffer before mixing3,13,14 |
| Organic modifier identity and content | Acetonitrile (dipolar, aprotic) and methanol (hydrogen-bond donor) interact differently with analytes and stationary phase; %B changes solvent strength above all but often changes α as well | Most analyte classes; Snyder’s first and cheapest selectivity experiment | A large retention change from a %B change is not evidence of a selectivity change until α has been recalculated9,14 |
| Temperature | Alters retention and relative retention through temperature-dependent ionization equilibria and solvation | Ionizable and polar compounds | A measurable selectivity variable in its own right, not only a way to lower viscosity and backpressure; combines well with a solvent-strength or gradient-steepness change because the mechanisms differ15,16 |
| Buffer type and ionic strength | Alters the ionic environment and the coupled equilibria of ionizable analytes | Ionizable analytes | System-specific; investigated experimentally rather than applied as a rule14 |
| Gradient conditions | Composition changes while the analytes migrate, so k and α are functions of time; gradient time and steepness, temperature, initial and final composition, dwell volume and column chemistry all move the critical pair | Every gradient method | Vary temperature and gradient steepness together, and model the critical pair rather than assign one α to the run. The linear-solvent-strength model defines an effective retention factor k* (the value when the band is at the column midpoint) and a corresponding α, which is what gradient-modeling software predicts3,17,18 |
Which selectivity variable should you try first?
The choice follows from the analyte chemistry and the observed failure mode. Ionizable compounds give pH and temperature the most leverage; structurally similar neutral compounds respond more to stationary-phase chemistry, modifier identity or gradient conditions; a pair that is already well separated in α but still poorly resolved needs an efficiency or peak-shape investigation, not a selectivity experiment. Table 5 summarizes the pairing.6,9 When the next experiment is a change of column chemistry, how C18, C8, phenyl, PFP and HILIC phases change selectivity compares the interactions each phase adds and how to choose a first and a second column to screen.
| Observed situation | High-value experiment | What to recalculate |
|---|---|---|
| Both peaks weakly retained (k < 1–2) | Increase retention (weaker mobile phase) | k1, k2, α, Rs |
| Reasonable k; α very close to 1 | A selectivity-changing experiment (below) | α, Rs, elution order |
| Ionizable critical pair | Controlled pH and temperature space | k, α, Rs, robustness |
| Neutral structural analogs | A genuinely different stationary-phase chemistry, or modifier identity | α, Rs |
| Gradient critical pair | Gradient steepness or time, temperature, column chemistry | Critical-pair Rs, retention model |
| Useful α but broad or distorted peaks | Efficiency, extra-column dispersion, overload, peak shape | N, widths, asymmetry, Rs |
How do you tell whether poor resolution is selectivity-limited?
The value of calculating α is that it classifies the limiting mechanism before an experiment is chosen. The sequence below is a measurement-driven way to decide whether retention, relative retention or efficiency and peak shape is the dominant limitation; it is not a universal optimization order.
- Verify tM and calculate k1 and k2 under conditions where the calculation is meaningful (isocratic, or an isocratic hold).
- Calculate α for the critical pair from the adjusted retention times.
- If both k values are very low, test whether inadequate retention is the limitation by weakening the mobile phase and recalculating.
- If retention is reasonable but α is close to 1, choose an experiment designed to change relative retention: pH for an ionizable pair, a different stationary-phase chemistry, modifier identity or temperature.
- Recalculate k1, k2, α and Rs after the experiment. Do not judge success from later retention times.
- If α is useful but the peaks remain broad or distorted, investigate efficiency, sample loading and extra-column dispersion, following the peak shape troubleshooting guide.
Worked case: adequate retention, low α
A critical pair has k1 = 5.00, k2 = 5.15 and poor resolution. Then α = 5.15/5.00 = 1.03, and the selectivity term is 0.03/1.03 = 0.029. Both compounds are well retained (the retention term is already 5.15/6.15 = 0.84), so further retention adds run time without addressing the problem: even at N = 15,000 the equation gives Rs ≈ 30.6 × 0.029 × 0.84 ≈ 0.75. The informative experiment is one that changes selectivity. If, say, a change of modifier moves α to 1.08, the term becomes 0.074 and the same column gives Rs ≈ 1.9. If α barely moves, a different selectivity dimension is tried; if α improves but Rs does not, the limitation is efficiency or peak shape and the plate number, asymmetry and loading are inspected next.6 How the plate number is calculated, and what a low value means, is covered in the HPLC theoretical plates and HETP guide.
What are the common errors with separation factor?
Table 6 lists the errors that recur in method-development records and how to avoid each.
| Error | Why it is wrong | Better practice |
|---|---|---|
| α = tR2/tR1 | Total retention includes tM; the ratio understates α | Use adjusted retention times or retention factors; keep tR2/tR1 for its compendial role as relative retention time |
| Any α > 1 means adequate separation | α alone does not determine Rs | Evaluate Rs, N, k, peak shape and the requirement |
| Later peaks mean better selectivity | Both peaks can move proportionally at constant α | Recalculate α after every change |
| A C18-to-C18 swap cannot change selectivity | Nominal chemistry does not guarantee identical interactions | Characterize or screen phases with a selectivity model |
| pH always changes α strongly | Only for ionizable analytes near their pKa | Use analyte chemistry and controlled experiments |
| Gradient α is a single constant | Composition changes during migration | Use gradient-aware interpretation or retention modeling |
Frequently asked questions
Can I calculate the separation factor directly from retention times?
Yes, provided the hold-up time is known: α = (tR2 − tM)/(tR1 − tM). Subtracting tM from each retention time gives the adjusted retention times, and their ratio is α; the division by tM that converts them to retention factors cancels. What cannot stand in for α is the ratio of the total retention times, tR2/tR1, which includes the hold-up time in both terms and is always closer to 1 than the true value; that ratio has its own use as the compendial relative retention time, not as a measure of selectivity. In the worked example above it gives 1.08 instead of 1.10; for an early-eluting pair the error is much larger.
Is separation factor the same as selectivity?
In everyday chromatographic usage, yes: “selectivity”, “selectivity factor” and “separation factor” all refer to α. Formally they differ. IUPAC names the quantity separation factor and discourages “selectivity” for it, because selectivity in analytical chemistry is the broader property of a procedure, the degree to which other substances interfere with the determination of the analyte. On this site “separation factor” is the number and “selectivity” is the behavior it measures, which is also how the term is used in the method-development literature when it speaks of selectivity changes.
Can α equal 1, or be less than 1?
Equal retention factors give α = 1, which means no differential retention: the two compounds co-elute exactly and no column length will separate them. By the IUPAC definition the two peaks are numbered so that the more retained is peak 2, which makes α greater than unity by construction, with exact co-elution (α = 1) the degenerate limit outside the definition; a value below 1 simply means the peaks have been numbered in the wrong order. When a selectivity experiment reverses the elution order of a pair, α passes through 1 on the way, and the pair co-elutes at some intermediate condition; this is why a variable that “improves” α can pass through a worse separation first.
What is a good separation factor in HPLC?
There is no universal good value. Adequacy depends on the plate number, the retention factor, the peak widths and shapes, the sample load and the analytical requirement, all of which enter the measured resolution. As orientation only, on a typical column of 10,000 plates with the pair adequately retained (k ≈ 4–5), α ≈ 1.10 gives a resolution near 1.8 and α ≈ 1.05 near 1.0, so α between about 1.05 and 1.10 is where a critical pair turns from unresolved to acceptably resolved on a conventional column. Higher efficiency lowers the α needed; tailing raises it. Validated and compendial methods set their criteria on measured resolution, not on α.
Why did retention increase but resolution barely change?
Because both peaks moved by nearly the same proportion, so α changed little and only the retention term of the resolution relationship, k/(1 + k), increased. That term is already 0.8 at k = 4 and can never exceed 1, so once the pair is reasonably retained a weaker mobile phase buys longer runs and wider peaks rather than separation. Calculate k1, k2, α and Rs before and after the change: if α is unchanged, the next experiment should alter the chemistry, not the solvent strength.
What is the difference between separation factor and resolution?
Separation factor measures relative retention only: α − 1 is the distance between the two peak centers in units of the first peak’s adjusted retention. Resolution measures how well the peaks are actually separated, which depends on that distance and on the peak widths, and therefore on the plate number and any peak distortion as well. Two pairs can have the same α and very different Rs if their columns differ in efficiency, and a pair with a modest α can be fully resolved on a very efficient column. Method requirements are written in terms of Rs; α is the diagnostic that tells you which lever to pull to reach it.
Can separation factor be used in gradient HPLC?
The concept of relative retention still applies, but a single isocratic α is an oversimplification because the mobile-phase composition, and with it both retention factors, change continuously while the analytes migrate. What is measured in a gradient run is the difference in retention time of the critical pair under one specific program, and it depends on the gradient time and steepness, the temperature, the dwell volume and the column chemistry. For gradient method development the practical approach is to change those variables and track the critical-pair resolution directly, or to use retention modeling, which works with an effective retention factor k* and the corresponding α, to predict it across the design space.
The takeaway
Separation factor is the ratio of two retention factors, α = k2/k1 = (tR2 − tM)/(tR1 − tM), and it is the term in the resolution relationship with the most leverage on a critical pair: from 1.05 to 1.10 it nearly doubles the resolution that a given column can deliver, a gain that would otherwise cost about 3.6 times the column length. It is also the term that retention alone cannot move, which is why a pair that is adequately retained but still overlapping needs a change of chemistry, in stationary phase, pH, modifier, temperature or gradient program, rather than a weaker mobile phase. Calculate it from adjusted retention times, recalculate it after every experiment, and read it alongside the plate number and the peak shape rather than against any fixed threshold.
References
- IUPAC, “separation factor, α in column chromatography”, Compendium of Chemical Terminology (the “Gold Book”), online version, DOI 10.1351/goldbook.S05614; from L. S. Ettre, Pure Appl. Chem. 65, 844 (1993).
- L. S. Ettre, “Nomenclature for chromatography (IUPAC Recommendations 1993)”, Pure Appl. Chem. 65(4), 819–872 (1993).
- L. R. Snyder, J. J. Kirkland and J. W. Dolan, Introduction to Modern Liquid Chromatography, 3rd ed., Wiley (2010).
- United States Pharmacopeia, General Chapter ⟨621⟩ Chromatography, USP–NF, DOI 10.31003/USPNF_M99380_01_01.
- IUPAC, “selectivity”, Compendium of Chemical Terminology (the “Gold Book”), online version, DOI 10.1351/goldbook.S05564; from Pure Appl. Chem. 55, 553 (1983).
- L. R. Snyder and J. W. Dolan, “Optimizing selectivity during reversed-phase high performance liquid chromatography method development: prioritizing experimental conditions”, J. Chromatogr. A 1302, 45–54 (2013).
- V. Samanidou, “Basic LC method development and optimization”, in Analytical Separation Science, Wiley-VCH (2015).
- J. H. Purnell, “The correlation of separating power and efficiency of gas-chromatographic columns”, J. Chem. Soc. 1268–1274 (1960).
- L. R. Snyder, “Changing reversed-phase high performance liquid chromatography selectivity. Which variables should be tried first?”, J. Chromatogr. B 689(1), 105–115 (1997).
- L. R. Snyder, J. W. Dolan and P. W. Carr, “The hydrophobic-subtraction model of reversed-phase column selectivity”, J. Chromatogr. A 1060(1–2), 77–116 (2004).
- J. J. Gilroy, J. W. Dolan and L. R. Snyder, “Column selectivity in reversed-phase liquid chromatography. IV. Type-B alkyl-silica columns”, J. Chromatogr. A 1000(1–2), 757–778 (2003).
- J. W. Dolan and L. R. Snyder, “Selecting an ‘orthogonal’ column during high-performance liquid chromatographic method development for samples that may contain non-ionized solutes”, J. Chromatogr. A 1216(16), 3467–3472 (2009).
- J. Ruta, J. Boccard, D. Cabooter, S. Rudaz, G. Desmet, J.-L. Veuthey and D. Guillarme, “Method development for pharmaceutics: some solutions for tuning selectivity in reversed phase and hydrophilic interaction liquid chromatography”, J. Pharm. Biomed. Anal. 63, 95–105 (2012).
- S. Heinisch and J.-L. Rocca, “Effect of mobile phase composition, pH and buffer type on the retention of ionizable compounds in reversed-phase liquid chromatography: application to method development”, J. Chromatogr. A 1048(2), 183–193 (2004).
- J. W. Dolan, “Temperature selectivity in reversed-phase high performance liquid chromatography”, J. Chromatogr. A 965(1–2), 195–205 (2002).
- S. Heinisch, G. Puy, M.-P. Barrioulet and J.-L. Rocca, “Effect of temperature on the retention of ionizable compounds in reversed-phase liquid chromatography: application to method development”, J. Chromatogr. A 1118(2), 234–243 (2006).
- J. W. Dolan, L. R. Snyder, D. L. Saunders and L. Van Heukelem, “Simultaneous variation of temperature and gradient steepness for reversed-phase high-performance liquid chromatography method development”, J. Chromatogr. A 803(1–2), 33–50 (1998).
- K. Jayaraman, V. Rajendran, K. Kumar and H. Bhutani, “A methodology employing retention modeling for achieving control space in liquid chromatography method development using quality by design approach”, J. Chromatogr. A 1635, 461658 (2021).
Reviewed against primary sources. Every equation, definition and threshold on this page is checked against the IUPAC Gold Book and the 1993 IUPAC recommendations on chromatographic nomenclature and against the primary literature cited above; USP General Chapter ⟨621⟩ is cited for the precedence of compendial criteria. Numerical examples are illustrative calculations from the equations stated and are not method-development predictions or acceptance criteria. For validated or compendial methods, the applicable procedure and regulatory framework take precedence over the general rules of thumb given here. Evidence review: September 2026.