
Retention factor (k) is the retention of an analyte expressed relative to the hold-up time of the column: the adjusted retention time divided by the hold-up time, k = (tR − tM)/tM. It is dimensionless, and it is the quantity that connects an observed retention time to separation factor and resolution.1
k = (tR − tM) / tM = t′R / tM
where tR is the total retention time of the analyte, tM is the hold-up time (the transit time of an effectively unretained component under the same conditions2), and t′R = tR − tM is the adjusted retention time.
If an analyte elutes at 6.00 min and the hold-up time is 1.00 min, k = (6.00 − 1.00)/1.00 = 5. A retention factor of 5 means the analyte spent five times as long held on the stationary phase as it spent moving in the mobile phase; its total time in the column is (1 + k) = 6 times the hold-up time. Retention factor is more useful than retention time alone because it normalizes retention to the mobile-phase transit time, which is what makes it the bridge between what the chromatogram shows and what method development can change: retention time gives k, two values of k give the separation factor α, and k, α and the plate number together give the resolution Rs, each defined below.3
retention time → k → α → Rs
See also: what chromatography is and how it works — the parent guide to retention, selectivity and efficiency.
What is retention factor in HPLC?
For column chromatography the retention factor can be written in terms of adjusted retention time or, equivalently, adjusted retention volume V′R and hold-up volume VM:1
k = t′R / tM = V′R / VM
Under the equilibrium assumptions of chromatographic nomenclature, the same quantity equals the ratio of the amount of analyte in the stationary phase to the amount in the mobile phase at equilibrium, which is why it also describes how the analyte is distributed between the two phases.1 Table 1 sets out the four quantities that appear in the definition.
| Quantity | Symbol | Meaning |
|---|---|---|
| Total retention time | tR | Time from injection to the analyte peak maximum |
| Hold-up time | tM | Transit time of an effectively unretained component |
| Adjusted retention time | t′R | tR − tM |
| Retention factor | k | t′R / tM, dimensionless |
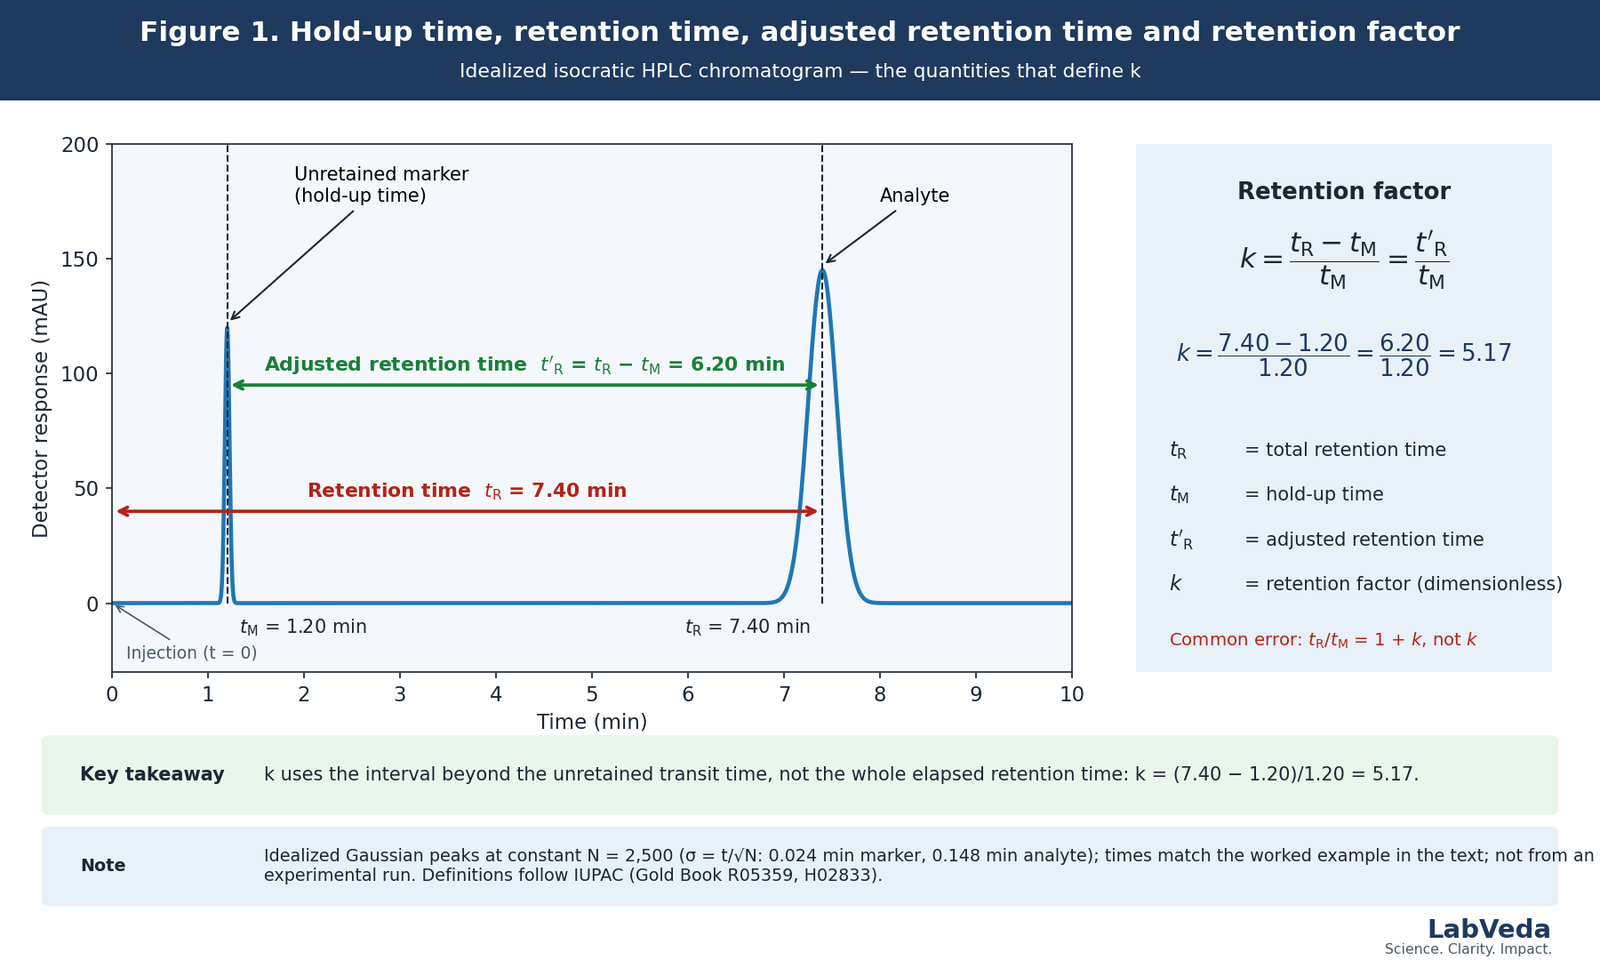
A common error is to divide tR directly by tM. That ratio is 1 + k, not k:
tR / tM = 1 + k
Using total rather than adjusted retention therefore overstates the retention factor by exactly 1, which matters most for weakly retained compounds. Figure 1 shows the distinction on an idealized chromatogram: retention factor uses the interval beyond the unretained transit time, not the whole elapsed retention time.
Why retention time alone is not a measure of retention
Suppose two systems both give tR = 6.00 min for the same analyte. On system A the hold-up time is 1.00 min, so k = (6.00 − 1.00)/1.00 = 5.0. On system B, a different column run with a stronger mobile phase, the hold-up time is 2.00 min, so k = (6.00 − 2.00)/2.00 = 2.0. The retention times are identical and the retention factors differ by a factor of 2.5. Retention time is an observation about one system; retention factor is a property of the analyte, column and mobile phase together, which is why tR should not be treated as a normalized measure of retention. Note that column length and flow rate are not what separates the two systems: both scale tR and tM by the same factor and leave k unchanged.
Chromatography Troubleshooting Decision Engine
Any HPLC symptom, one starting point — the engine narrows hundreds of failure modes to the few that fit your evidence.
How do you calculate retention factor? A worked example
An analyte elutes at tR = 7.40 min and the measured hold-up time is tM = 1.20 min.
t′R = 7.40 − 1.20 = 6.20 min
k = 6.20 / 1.20 = 5.17
The analyte has a retention factor of 5.17, quoted to three significant figures because the input times carry three. The calculation is trivial; the two things that are not trivial are the value of tM that goes into it and what the result means for the separation, and the rest of this page is about those.
Is it k or k′? Retention factor versus capacity factor
The preferred term is retention factor with the symbol k. The primed symbol k′ became common in the liquid-chromatography literature, and older texts also use capacity factor, capacity ratio, partition ratio or mass distribution ratio for the same quantity. The IUPAC recommendations identify the quantity with k, note that the recognized nomenclatures (IUPAC, BS and ASTM) have always done so, and state that there is no reason to add the prime.4 The IUPAC Gold Book entry for retention factor carries the same note.1 Legacy terms are worth recognizing when you meet them in a method or a paper; they are not worth propagating.
What does a retention factor value mean?
Table 2 gives the qualitative reading of a retention factor. The numbers that matter for resolution are in the next section.
| Retention factor | Interpretation |
|---|---|
| k ≈ 0 | Essentially unretained under the stated conditions |
| Low k (below about 1) | Little retention beyond mobile-phase transit; retention may be limiting the separation |
| Intermediate k (about 1–10) | Substantial retention without excessive run time; the usual isocratic working range |
| High k (above about 10) | Strong retention; further increases usually give diminishing resolution benefit for the run time they cost |
The often-quoted rule that useful isocratic retention falls between k ≈ 1 and 10 is a working heuristic for method development, not an acceptance criterion.3 The appropriate retention depends on the analyte chemistry, the chromatographic mode, the selectivity and efficiency available, the detection, the matrix and the run-time objective. For validated or compendial methods, the applicable procedure and its system-suitability requirements, such as those in USP General Chapter ⟨621⟩ Chromatography, take precedence over the general rules of thumb given here.5
Why does retention factor matter for HPLC resolution?
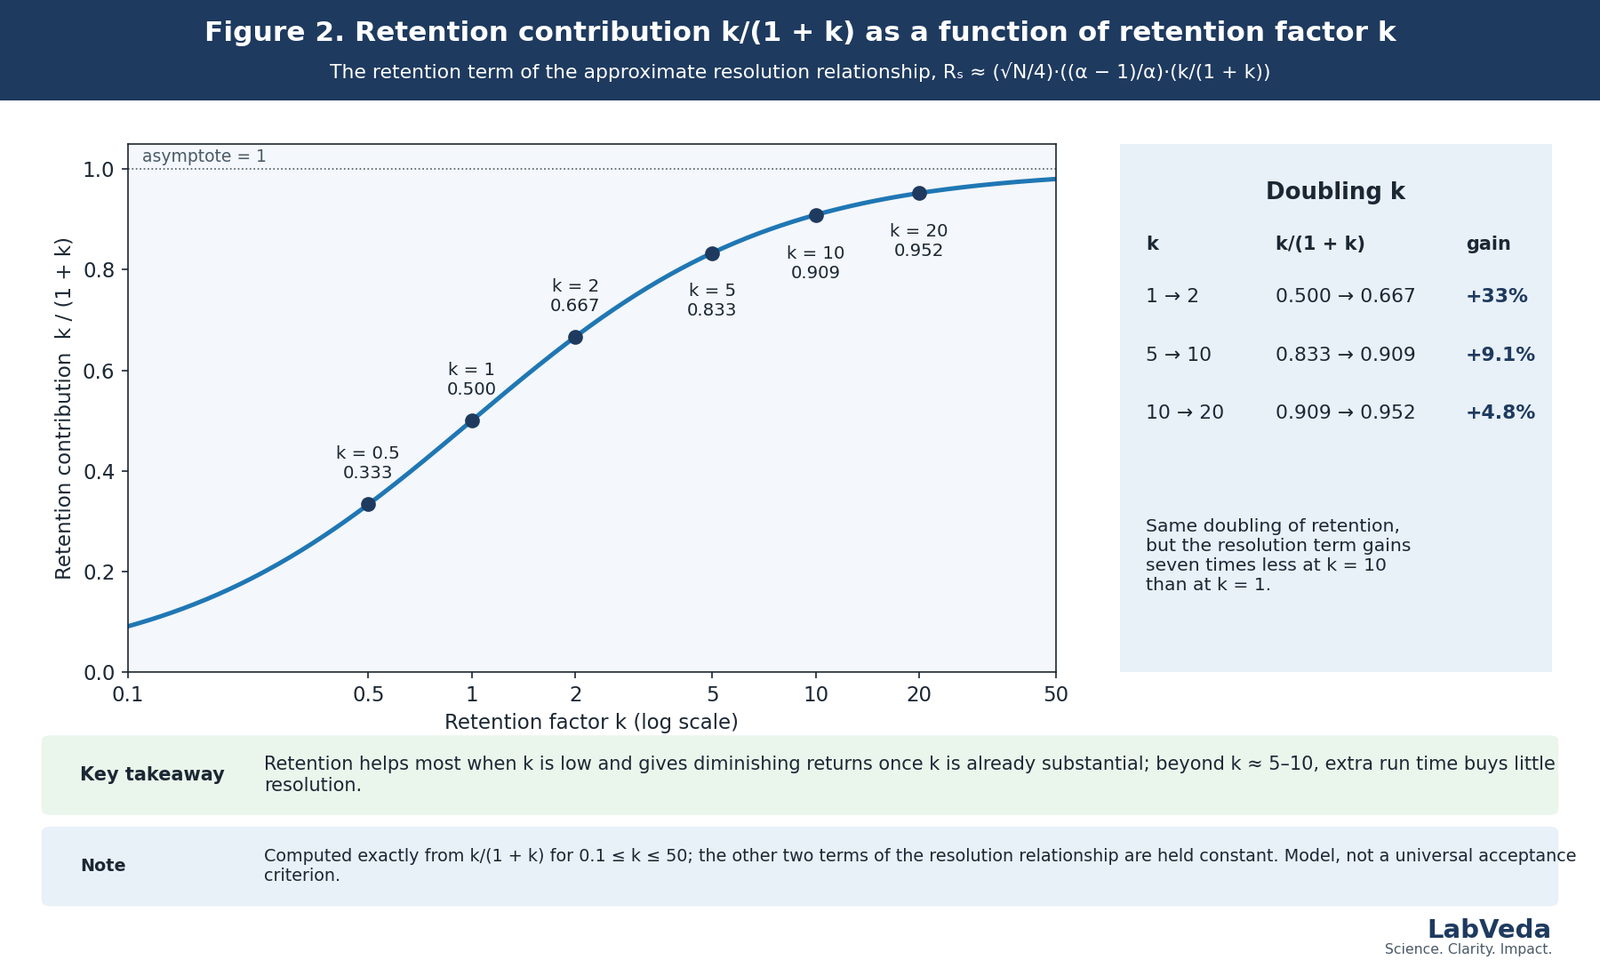
For an idealized isocratic separation, a widely used approximate relationship separates resolution into contributions from efficiency, separation factor and retention:3
Rs ≈ (√N / 4) × ((α − 1) / α) × (k / (1 + k))
where Rs is the resolution of the pair, N is the plate number (taken as the same for both peaks), α the separation factor and k the retention factor of the second peak of the pair. The three terms are treated in full in the HPLC resolution guide; here the point is the retention term alone:
k / (1 + k)
This term rises steeply when k is small and approaches 1 asymptotically. Table 3 tabulates it and Figure 2 plots it. The practical consequence is that adding retention improves resolution strongly when k is low and progressively less once retention is already substantial.
| k | k/(1 + k) | Gain on doubling k |
|---|---|---|
| 0.25 | 0.200 | — |
| 0.5 | 0.333 | +67% |
| 1 | 0.500 | +50% |
| 2 | 0.667 | +33% |
| 5 | 0.833 | — |
| 10 | 0.909 | +9.1% |
| 20 | 0.952 | +4.8% |
| 50 | 0.980 | — |
Why more retention is not always better
Increase k from 1 to 2 and the retention term goes from 0.500 to 0.667:
0.6667 / 0.5000 = 1.333, a gain of 33%
Increase k from 10 to 20 and it goes from 0.909 to 0.952:
0.9524 / 0.9091 = 1.048, a gain of 4.8%
The same doubling of retention that buys a third more resolution at k = 1 buys under 5% at k = 10, and the run time it costs rises with k: since tR = tM(1 + k), going from k = 1 to 2 lengthens the retention time by 50% (2 tM to 3 tM) and going from 10 to 20 lengthens it by 91% (11 tM to 21 tM). Extra retention can still be the right move for a well-retained pair, for example to move it clear of a matrix front, but it should not be assumed to be the highest-leverage change for a difficult critical pair.
How are retention factor and separation factor different?
For two adjacent peaks IUPAC defines the separation factor as the ratio of their retention factors, with the convention that it is at least 1:6
α = k2 / k1 (k2 ≥ k1)
Retention factor describes one analyte; separation factor compares two. If both retention factors increase in proportion, both peaks move later and α barely changes: the chromatogram gets longer without the critical pair getting any better separated. That is the distinction to keep in mind whenever an increase in retention is proposed as a fix for poor resolution. How to calculate it, and which variables change it, is covered in the HPLC separation factor guide.
What controls retention factor?
Retention factor depends on the retention mechanism and on how the analyte distributes between mobile and stationary phases. The variables that change k include mobile-phase composition and solvent strength, stationary-phase chemistry, analyte structure and hydrophobicity, analyte ionization state, mobile-phase pH and buffer, temperature, ionic strength or competing ions in the modes where they matter, and secondary or mixed-mode interactions where they exist.3 The direction of each effect is mode-dependent: increasing the organic modifier usually decreases retention in reversed-phase LC, but that statement does not transfer to HILIC, normal-phase, ion-exchange or mixed-mode separations.
Retention factor and mobile-phase strength in reversed-phase HPLC
The common reversed-phase retention model is the linear solvent strength (LSS) relationship:3,7
log k = log kw − Sφ
where φ is the volume fraction of the strong (organic) solvent, kw is the retention factor extrapolated to pure water and S (positive in reversed phase) describes how strongly retention responds to solvent composition. The relationship is useful and approximate. A recent analysis of the model for isocratic reversed-phase separations found that S is compound-specific and column-dependent rather than a general solvent property, and that log kw depends on both column and solvent.8 The practical implication is that modest changes in organic composition can move retention substantially, but the size of the response has to be measured for the actual analytes and column rather than taken from a generic value. This is the reason mobile-phase strength is the first scouting variable in how to develop an HPLC method.
What is hold-up time and how is it measured?
IUPAC defines the hold-up time as the time required to elute a component whose concentration in the stationary phase is negligible relative to that in the mobile phase, that is, an effectively unretained component.2 Because tM appears in both the numerator and the denominator of the retention-factor equation, the accuracy of every k you calculate rests on it. A measured hold-up time also includes the extra-column transit through injector, tubing and detector cell, which on a low-dispersion column can be a noticeable fraction of the whole; subtract it, or at least know it, before comparing k values between systems.3 How tM relates to the column volume and how it is estimated in practice is covered in the column void volume guide.
Why an incorrect hold-up time distorts k
Consider an analyte with tR = 1.50 min.
If tM = 1.00 min: k = (1.50 − 1.00) / 1.00 = 0.50
If tM is estimated as 0.90 min: k = (1.50 − 0.90) / 0.90 = 0.667
A 10% error in the hold-up time changes the calculated k from 0.50 to 0.667, a 33% relative difference, from the hold-up estimate alone. For a well-retained compound the same error is a small fraction of t′R and matters much less; it is for weakly retained compounds that tM uncertainty becomes consequential.
Hold-up time markers
Common practical markers in reversed-phase LC include uracil, thiourea and acetone,9 but the assumption that any of them is perfectly unretained is not universally valid. Molecular simulations of dead-time markers on reversed-phase stationary phases show that commonly used markers can interact with the bonded phase and so behave non-ideally.10 A recent review of phase-volume measurement in HPLC columns likewise describes determining the mobile-phase volume as a real experimental challenge, with different tracers suited to different retention mechanisms and no single approach that is correct for every column.9 Treat any marker as an experimental approximation that has to be appropriate for the stationary phase, the mobile phase and the retention mechanism, and record which marker a reported k was measured against.
Hold-up time, dead time and void time
Laboratory usage mixes hold-up time, dead time and void time, and the symbols tM and t0, for what is usually the same quantity. Hold-up time (tM) is the IUPAC term and is the one to use when the retention-factor definition is meant;2 the others are worth recognizing, and worth checking, because “dead volume” in particular is also used for extra-column volume, which is a different thing.
Is retention factor valid in gradient HPLC?
The simple interpretation of k is most direct for isocratic chromatography, where the mobile-phase composition is constant while the analyte migrates. In gradient elution the composition changes with time, so the analyte experiences a changing retention environment as it moves through the column, and classical gradient theory treats retention, resolution and band width as functions of the gradient conditions rather than of a single constant k.7 A numerical ratio (tR − tM)/tM can always be formed from a gradient chromatogram, but interpreting it as the mechanistic constant used in isocratic theory is generally inappropriate. Keep three things distinct: the observed gradient retention time, the isocratic retention factor at a defined composition, and the parameters of a gradient-retention model such as the LSS k*, the effective retention factor of a band at the midpoint of its migration, used in that theory.
Why retention changes during method transfer
Unexpected retention changes on transfer arise from differences in mobile-phase composition, pH, temperature, column chemistry, flow rate and column dimensions. Gradient methods add system-dependent variables: dwell volume, mixer configuration, gradient delay, the actual solvent proportioning and extra-column volume. Because gradient retention depends on the solvent history the column actually sees, two instruments running the same programmed gradient can produce different retention.3,7 The diagnostic path for that case is in the retention-time drift guide.
How do you tell whether poor resolution is retention-limited?
Retention factor is more useful as a decision than as a number. The sequence below turns it into one.
- Verify tM. If the hold-up time is uncertain, establish or re-measure it before interpreting any k.
- Calculate k1 and k2 for the critical pair under isocratic conditions.
- If both values are very low, retention limitation is plausible. Apply a mechanistically appropriate change expected to increase retention.
- Recalculate k1, k2, α and Rs after the change.
- If k increased but Rs barely improved, retention was probably not the dominant remaining limitation. Inspect α.
- If α remains close to 1, prioritize a selectivity-changing experiment (stationary phase, organic modifier, pH, temperature).
- If the peaks are broad despite reasonable k and α, investigate efficiency, peak shape and system dispersion.
As a worked case: two early-eluting peaks have k1 = 0.35 and k2 = 0.42 and poor resolution. The separation factor is α = 0.42/0.35 = 1.20, which is respectable, while the retention term for the second peak is only 0.42/1.42 = 0.30, so insufficient retention is the more likely limitation. The discriminating experiment is a condition change expected to increase retention, followed by recalculating k1, k2, α and Rs. Three outcomes are possible. If both k values rise and Rs improves substantially, retention was an important limitation. If both k values rise but Rs improves little, relative retention is limiting and α is the next thing to work on. If retention rises but the peaks broaden or distort, the intervention has introduced or exposed another limitation, and the peak shape troubleshooting guide is the next stop. Table 4 collects these and the other common observations into a matrix.
| Observation | Possible interpretation | Discriminating experiment | Next metric |
|---|---|---|---|
| k ≈ 0 | Essentially unretained | Increase retention by a mode-appropriate change | k, Rs |
| Both critical peaks have low k | Retention may limit Rs | Increase retention | k, α, Rs |
| k rises but Rs barely changes | Relative retention dominates | Calculate α; change selectivity | α |
| Very high k | Excessive retention | Increase elution strength | Run time, Rs |
| k changes unexpectedly | Conditions or system changed | Verify composition, pH, temperature, column | tM, k |
| Calculated k looks implausible | tM may be wrong | Re-measure the hold-up time | tM |
| Gradient k treated as isocratic k | Model mismatch | Review the gradient model and conditions | Gradient retention |
| Same tR on different systems | Same tR does not imply same k | Determine tM on each | k |
Frequently asked questions
Is capacity factor the same as retention factor?
Yes. Capacity factor, capacity ratio, partition ratio and mass distribution ratio are older names for the quantity now called retention factor, and k′ is the older symbol for it. IUPAC nomenclature uses k without the prime and notes that the recognized nomenclatures have always identified the quantity that way.4 When a method or a paper says k′, read it as k; the number is the same, only the label has changed.
What is a good retention factor in HPLC? Is k between 1 and 10 required?
There is no universal acceptable k. Retention factors between about 1 and 10 are a practical isocratic working range: enough retention that the peak is clear of the hold-up region, not so much that run time is wasted on a retention term that has already flattened. That range is a method-development heuristic, not an analytical or regulatory requirement, and a validated or compendial procedure defines its own system-suitability criteria.5
What happens when k is too low?
The analyte elutes close to the hold-up time, with little retention beyond mobile-phase transit. The retention term k/(1 + k) is then small (0.33 at k = 0.5, 0.20 at k = 0.25), so resolution from a neighbor is limited however good the efficiency and selectivity are, and the peak is exposed to whatever elutes at the solvent front.3 Increasing retention is the first thing to try, but only if tM has been verified, because low k is where hold-up error distorts the value most.
Is a higher retention factor always better?
No. The retention contribution to resolution behaves as k/(1 + k), so it gains 33% when k goes from 1 to 2 but under 5% when k goes from 10 to 20, while the retention time grows by 50% in the first case and 91% in the second.3 Beyond about k ≈ 5–10, extra retention is buying time, not resolution; if the critical pair is still unresolved there, the separation factor or the efficiency is the limitation, not the retention.
Is dead time the same as hold-up time?
In most laboratory usage, yes: dead time, void time and t0 all usually mean the transit time of an unretained component. Hold-up time (tM) is the IUPAC term and the one that belongs in the retention-factor definition.2 The one caution is that “dead volume” is also used for extra-column volume in tubing and fittings, which is a different quantity, so check which meaning a document intends before using its number.
Can uracil always be used to measure the hold-up time?
No. Uracil, thiourea and acetone are common reversed-phase markers, but molecular simulations show that such markers can interact with the bonded phase and are not perfectly unretained,10 and the wider literature on phase-volume measurement treats the choice of tracer as mechanism-dependent rather than settled.9 Use a marker appropriate to the stationary phase and mobile phase, be aware that the value it gives is an approximation, and state which marker was used alongside any k you report.
Can retention factor be calculated for gradient HPLC?
A time ratio can always be formed from a gradient chromatogram, but it is not the constant isocratic retention factor that the resolution relationship assumes, because the mobile-phase composition changes while the analyte is on the column.7 Gradient theory works with retention parameters defined for the gradient (such as the LSS k*, the effective retention factor at the midpoint of a band’s migration), and comparisons between gradient runs should use those or the observed retention times, not an isocratic k read off a gradient.
The takeaway
Retention factor converts an observed retention time into a normalized chromatographic quantity, tR → t′R → k; for two analytes the retention factors give the separation factor, k1, k2 → α; and with the plate number they give resolution, k, α, N → Rs. Its value rests on a trustworthy hold-up time, it means what the isocratic theory says only under isocratic conditions, and its leverage on resolution is large at low k and small once retention is already substantial. The useful method-development question is therefore not “Is my k value good?” but “Is retention limiting this critical pair, and will changing retention actually improve the separation?”
References
- IUPAC, “retention factor, k in column chromatography”, Compendium of Chemical Terminology (the “Gold Book”), online version, DOI 10.1351/goldbook.R05359; from L. S. Ettre, Pure Appl. Chem. 65, 843 (1993).
- IUPAC, “hold-up volume (time), VM (tM) in column chromatography”, Compendium of Chemical Terminology (the “Gold Book”), online version, DOI 10.1351/goldbook.H02833.
- L. R. Snyder, J. J. Kirkland and J. W. Dolan, Introduction to Modern Liquid Chromatography, 3rd ed., Wiley (2010).
- L. S. Ettre, “Nomenclature for chromatography (IUPAC Recommendations 1993)”, Pure Appl. Chem. 65(4), 819–872 (1993).
- United States Pharmacopeia, General Chapter ⟨621⟩ Chromatography, USP–NF, DOI 10.31003/USPNF_M99380_01_01.
- IUPAC, “separation factor, α in column chromatography”, Compendium of Chemical Terminology (the “Gold Book”), online version, DOI 10.1351/goldbook.S05614.
- L. R. Snyder, J. W. Dolan and J. R. Gant, “Gradient elution in high-performance liquid chromatography. I. Theoretical basis for reversed-phase systems”, J. Chromatogr. 165(1), 3–30 (1979).
- C. F. Poole and S. N. Atapattu, “Analysis of the solvent strength parameter (linear solvent strength model) for isocratic separations in reversed-phase liquid chromatography”, J. Chromatogr. A 1675, 463153 (2022).
- V. David, J. Petre and S. C. Moldoveanu, “Challenges in the measurement of the volume of phases for HPLC columns”, Molecules 30(9), 2062 (2025).
- N. Trebel, A. Höltzel, A. Steinhoff and U. Tallarek, “Insights from molecular simulations about dead time markers in reversed-phase liquid chromatography”, J. Chromatogr. A 1640, 461958 (2021).
Reviewed against primary sources. Every equation, definition and threshold on this page is checked against IUPAC chromatography nomenclature (the Gold Book and the 1993 Recommendations) and the primary literature cited above; the precedence of compendial procedures follows USP General Chapter ⟨621⟩. Numerical examples are illustrative calculations from the equations stated and are not method-development predictions or acceptance criteria; heuristic retention ranges are working guidance, not system-suitability requirements. For validated or compendial methods, the applicable procedure and regulatory framework take precedence over the general rules of thumb given here. Evidence review: September 2026.