
The plate number N, also called the number of theoretical plates, is the dimensionless measure of how narrow a chromatographic peak is relative to its retention time. For a Gaussian peak, N = 16(tR/wb)² = 5.545(tR/wh)², where wb is the width at the base and wh the width at half height. Plate height H, the height equivalent to a theoretical plate (HETP), is the column length divided by the plate number, H = L/N: the lower H, the more efficient the column per unit length.1,2
A theoretical plate is a model, not a physical object. What the laboratory measures is band broadening: at the same retention time a narrower peak gives a larger N, which is why plate number is spoken of as column efficiency. This page gives the equations and their conventions, works an example, explains why a measured plate number belongs to the whole system rather than to the column alone, and shows how to decide whether a poorly resolved pair is efficiency-limited. With retention factor and separation factor it completes the three terms of the resolution relationship. Part of the broadening that lowers a measured plate number arises outside the column, as explained in extra-column dispersion.
See also: what chromatography is — where column efficiency fits among the separation fundamentals.
Chromatography Troubleshooting Decision Engine
Any HPLC symptom, one starting point — the engine narrows hundreds of failure modes to the few that fit your evidence.
What is a theoretical plate in HPLC?
The plate model comes from distillation, where a column is divided into stages at each of which the two phases reach equilibrium. In chromatography the analogy is loose, and the IUPAC Gold Book entry for plate number defines it without reference to any physical stage: it is a number “indicative of column performance”, calculated from the retention time and the width of the peak, with the three equivalent forms given in Table 1.1,3 All three assume a Gaussian peak. Peak width at the base, wb, is the segment of baseline cut by tangents to the inflection points and equals 4σ for a Gaussian; the width at half height, wh, equals 2.355σ, and 5.545 is 8 ln 2, so the three forms give the same N for the same ideal peak.3
| Peak-width measure | Equation | Assumption and note |
|---|---|---|
| Standard deviation, σ | N = (tR/σ)² | Gaussian peak; σ from the second moment or from a fitted curve |
| Width at the base, wb | N = 16(tR/wb)² | Gaussian peak; wb = 4σ from the tangents at the inflection points |
| Width at half height, wh | N = 5.545(tR/wh)² | Gaussian peak; 5.545 = 8 ln 2. USP ⟨621⟩ and Ph. Eur. 2.2.46 use this form with the coefficient rounded to 5.54 |
| Width at 10% height, w0.1, with asymmetry b/a measured there | N = 41.7(tR/w0.1)² / (b/a + 1.25) | Exponentially modified Gaussian; corrects the overestimate that the Gaussian forms give for tailing peaks |
The conventions diverge as soon as a peak is not Gaussian: for a tailing peak both Gaussian forms overestimate the plate number, and the error grows with the asymmetry, which is what the Foley–Dorsey form in Table 1 corrects.4 Data systems offer several conventions, sometimes under the same name, so a plate number reported without its width convention cannot be compared with anyone else’s.5
How do you calculate the number of theoretical plates? A worked example
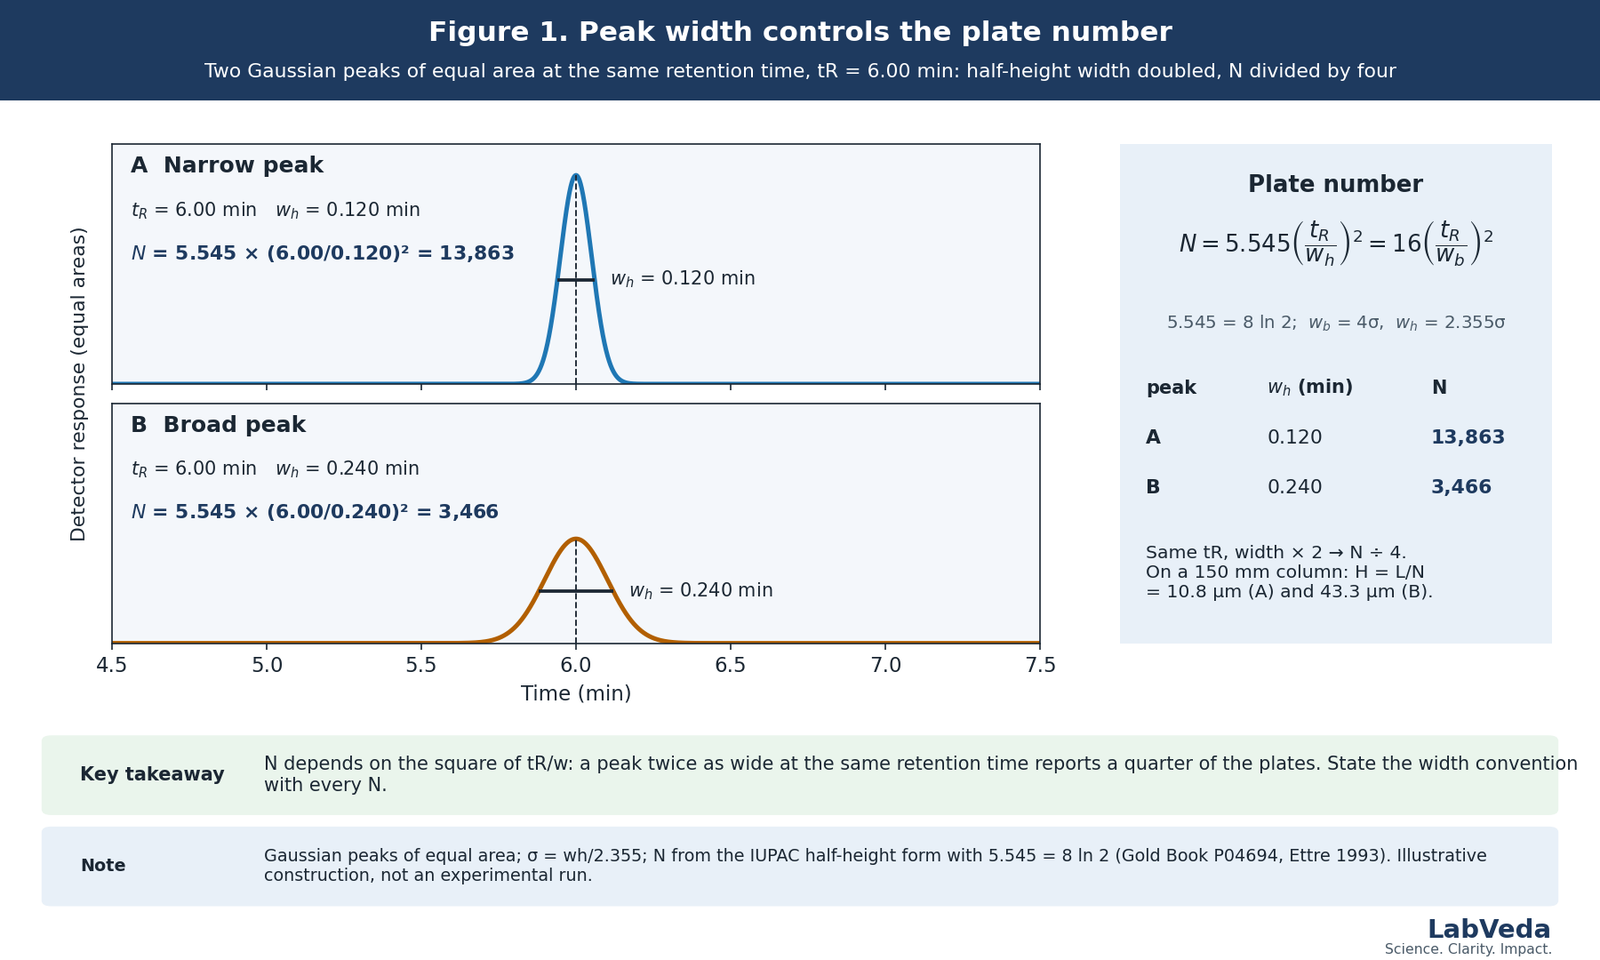
An analyte elutes at tR = 6.00 min with a half-height width wh = 0.120 min on a 150 mm column.
N = 5.545 × (6.00 / 0.120)² = 5.545 × 2,500 = 13,863
H = L / N = 150 mm / 13,863 = 0.0108 mm = 10.8 µm
N is dimensionless; H has units of length and is quoted with the column length and the test conditions. With the compendial coefficient 5.54 the same peak gives N = 13,850, a 0.1% difference that is negligible for a system-suitability test; the discrepancies that matter arise when the base-width and half-height forms are applied to a non-Gaussian peak without stating which was used.6 Figure 1 shows the consequence of the width entering as a square: a peak twice as wide at the same retention time reports a quarter of the plates.
What is HETP and how is plate height calculated?
Plate height, H, is the column length divided by the plate number; IUPAC gives the same quantity the name height equivalent to one theoretical plate, HETP.2
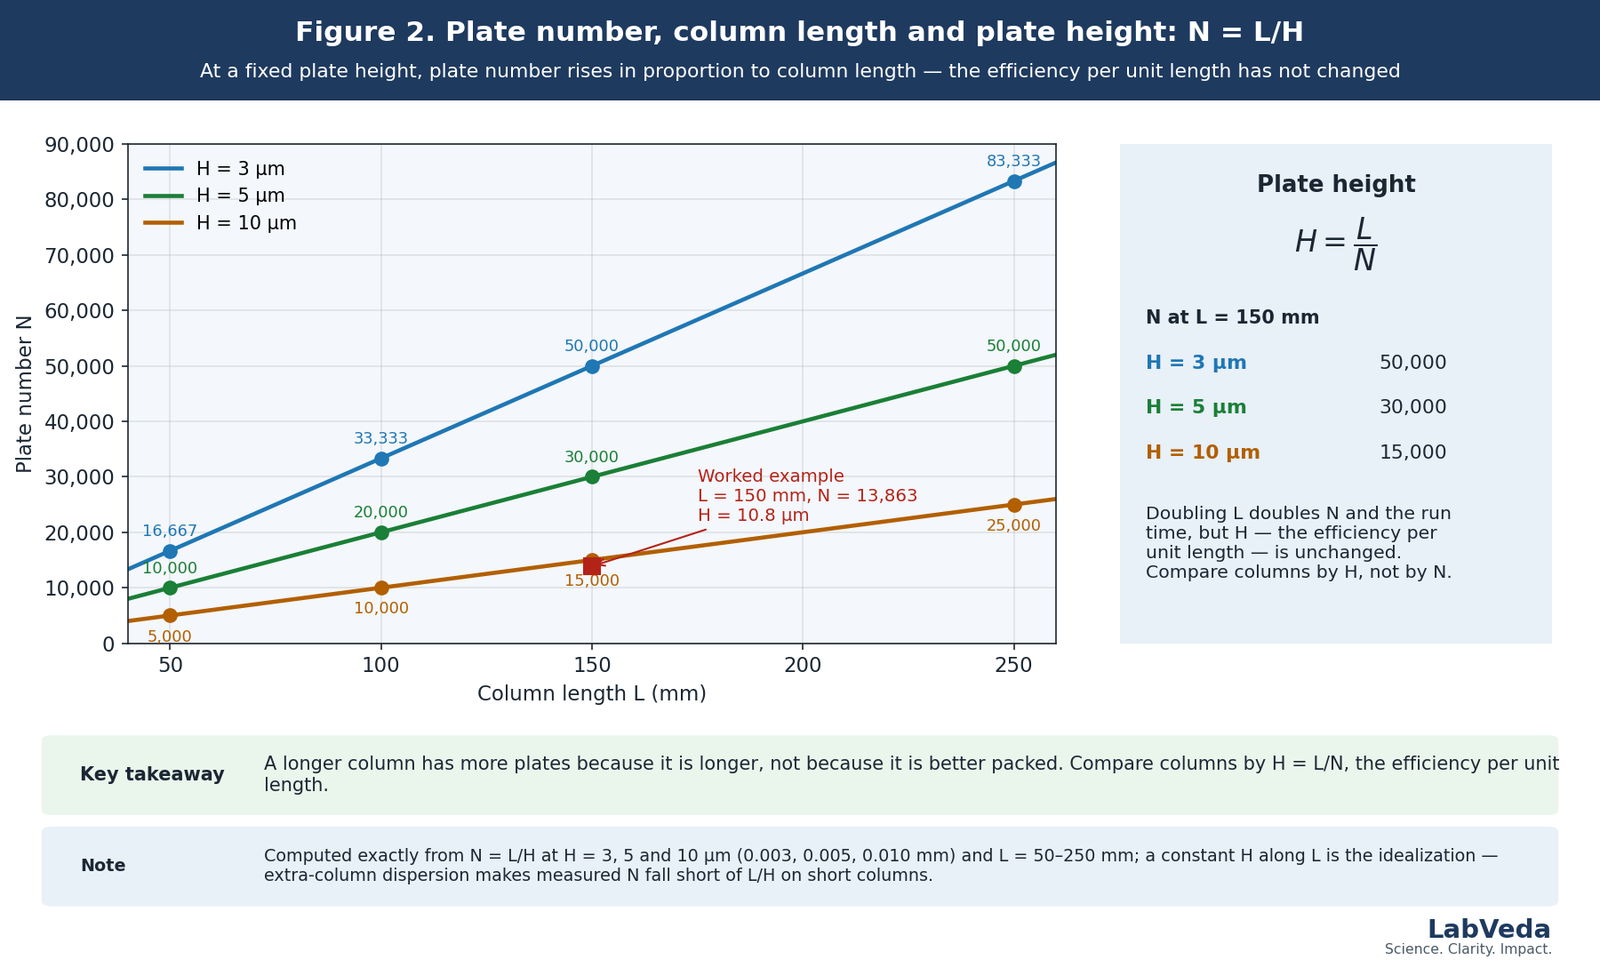
H = L / N
The point of H is normalization. At a fixed plate height the plate number rises in proportion to column length: a 250 mm column with 50,000 plates and a 100 mm column with 20,000 are equally efficient per unit length (H = 5 µm in both), and the longer one simply has more of it, at 2.5 times the run time and pressure. Figure 2 plots N = L/H for three plate heights and marks the worked example. Raw plate numbers therefore say nothing about packing quality across column lengths; H, or the reduced plate height h = H/dp, where dp is the particle diameter, when particle sizes also differ, is the quantity to compare. As a working rule a well-packed column near its optimum velocity gives h ≈ 2–3, so a 5 µm column reaches H ≈ 10–15 µm and a 1.7 µm column H ≈ 3.4–5.1 µm; values well above that mean something other than the particle size is limiting the efficiency.5,7
Why is a measured plate number not a property of the column alone?
A plate number read from a chromatogram is conditional. It depends on the analyte and its retention factor, the mobile phase, the temperature, the linear velocity, the injection volume and solvent, the sample load, the integration settings and the width convention, as well as on the packed bed. The peak that reaches the detector has been broadened by every element of the flow path, and the variances add:9
σ²observed = σ²column + σ²extra-column
where σ²extra-column collects the injector, the connecting tubing, the detector cell and the data-acquisition rate. Because N is calculated from the observed width, the measured plate number is always lower than the column’s own, and the shortfall is largest when the column’s peak variance is small: early-eluting peaks, short and narrow-bore columns, sub-2 µm and core–shell packings, where the instrument can hide half of the column’s plates.8,9 The column’s own efficiency can be recovered only by measuring the instrument’s variance under the same conditions and subtracting it.10 Vendor specifications are therefore meaningful only under the test conditions printed with them, and a low measured N does not by itself show that a column is defective. Table 2 sorts the sources of broadening by origin, which is the first question the diagnosis has to answer.
| Origin | Mechanisms | What distinguishes it |
|---|---|---|
| Column | Packing heterogeneity, voids and channels, frit blockage, contamination of the inlet, slow mass transfer in and out of the particles | Affects all analytes on that column; persists when the column is moved to another system; often accompanies a pressure change |
| Method | Velocity away from the optimum, mobile-phase viscosity and temperature, low retention, injection solvent stronger than the mobile phase, sample overload | Changes with the operating conditions; often analyte- or load-dependent; peak shape distorts before N collapses |
| System | Injector and needle-seat volume, tubing length and bore, fittings and dead volume at connections, detector cell volume, data rate and filtering | Largest for early peaks and small-volume columns; unchanged by swapping the column; reproduced by the same instrument with any column |
Why does the theoretical plate count become low?
Table 3 lists the causes that recur when a system-suitability plate count falls or a new column reads below specification, with the observation that points to each and the experiment that confirms it. Several of them change the peak shape before they change the number, which is why an asymmetric peak should be diagnosed as a shape problem, following the peak shape troubleshooting guide, rather than read as an efficiency figure.
| Cause | Observation | Confirmation |
|---|---|---|
| Width convention or integration changed | N moves when the data system’s settings move; peaks look unchanged | Reprocess the same raw data with the prescribed convention and integration parameters |
| Peak asymmetry or overload | Tailing or fronting; N falls as the injected mass rises | Inject a dilution series; if N recovers, the load was the cause |
| Injection solvent stronger than the mobile phase | Distortion worst for the earliest peaks; improves with smaller volume | Re-inject in the mobile phase or a weaker solvent at the same volume |
| Extra-column dispersion | Loss worst for early peaks and small-volume columns; a longer or wider column looks “better” | Measure the system variance with a zero-dead-volume union in place of the column (a lower bound: the contribution with the column installed is larger); audit tubing bore and length, fittings and cell volume |
| Velocity away from the optimum | N changes systematically with flow rate | Run three or four flow rates under otherwise identical conditions and compare H |
| Column contamination or inlet fouling | Efficiency and shape deteriorate over successive injections; pressure may rise | Reverse-flush or replace the inlet frit or guard; re-test with the column’s reference conditions |
| Bed collapse, void or frit damage | Abrupt, persistent loss of efficiency, often with split or shouldered peaks | Check the pressure history for shocks; test on the vendor’s conditions; replace if confirmed |
| Temperature and viscosity | N tracks column temperature or mobile-phase composition | Thermostat the column and compare at controlled temperature |
| Inadequate retention | An early peak (k below about 1) has a low effective plate number even when its classical N is normal, and its classical N is the most exposed to extra-column dispersion | Calculate k and increase retention; compare with the effective plate number below |
How does plate number affect HPLC resolution?
In the approximate resolution relationship for two adjacent peaks, efficiency enters through the square root of N:5
Rs ≈ (√N / 4) × ((α − 1) / α) × (k2 / (1 + k2))
where α is the separation factor and k2 the retention factor of the second peak; the three terms and their interaction are treated in the HPLC resolution guide. The square root is the practical constraint. Doubling N, by doubling the column length at the same plate height, raises the efficiency term by √2, or 41%, and doubles the run time and the pressure; quadrupling N is needed to double it. Table 4 gives the numbers. That is why efficiency is the term to pursue when selectivity is already adequate and the peaks are simply too wide, and the wrong term to pursue when the pair has α close to 1: moving α from 1.05 to 1.10 nearly doubles the resolution, a gain that would otherwise need about 3.6 times the column length, as the HPLC separation factor guide shows.
| N | √N/4 | Change from the row above | Rs at α = 1.05, k2 = 5 |
|---|---|---|---|
| 2,500 | 12.5 | — | 0.50 |
| 5,000 | 17.7 | +41% | 0.70 |
| 10,000 | 25.0 | +41% | 0.99 |
| 20,000 | 35.4 | +41% | 1.40 |
| 40,000 | 50.0 | +41% | 1.98 |
What is the effective plate number?
The classical plate number uses the total retention time, which includes the hold-up time tM, the time every compound spends in the mobile phase and the retention time of an unretained marker. The effective plate number Neff uses the adjusted retention time t′R = tR − tM instead, and so measures the efficiency that actually contributes to separating retained compounds; the retention factor k that appears in the last form is defined in the HPLC retention factor guide:3,11
Neff = 16(t′R / wb)² = 5.545(t′R / wh)² = N × (k / (1 + k))²
For the worked example with a hold-up time of 1.00 min, t′R = 5.00 min, k = 5 and Neff = 5.545 × (5.00/0.120)² = 9,627, which is 13,863 × (5/6)². The two numbers are not interchangeable: Neff is always smaller, the difference is large for weakly retained peaks (at k = 1, Neff is only a quarter of N) and small for well-retained ones, and any report or software that quotes an effective plate number has to say so. Its value depends on a trustworthy hold-up time, which is measured as described in the column void volume guide.
Can you calculate theoretical plates from a gradient run?
The data system will produce a number, but it is not the isocratic plate number. The plate equations assume that the analyte migrates at a constant velocity under constant conditions; in gradient elution the mobile-phase strength rises while the band is on the column, the rear of the band always sees a stronger eluent than the front, and the band is slightly compressed as it elutes. Because every analyte leaves the column at roughly the same effective retention factor k*, gradient peak widths are roughly constant across the run and depend on the gradient steepness as much as on the column, so a plate number computed from them measures the gradient program as much as the bed. Gradient theory handles this through the effective retention factor k* at the column midpoint and a gradient-specific peak-width expression rather than through an isocratic N.5,12 A gradient-derived plate count is useful only within one method, as a system-suitability criterion or trend; it should not be compared with an isocratic specification or between methods.
Is there a minimum plate count for an HPLC method?
No universal minimum exists. A figure such as “2,000 plates” appears in some monographs and some laboratories’ practice, and it is a legitimate criterion for the method it belongs to, but it is not a chromatographic law: a 50 mm column packed with 1.7 µm particles delivers around 10,000 plates, a 250 mm column of 5 µm particles around 20,000, and a method that needs 40,000 to resolve its critical pair will fail with 20,000 however well the column is packed. Compendial and validated procedures set their own system-suitability requirements, name the calculation they expect (USP General Chapter ⟨621⟩ uses the half-height width with the coefficient 5.54), and those requirements take precedence over any general figure.6
How do you tell whether poor resolution is efficiency-limited?
The plate number closes the diagnosis that the retention factor and the separation factor open. Poor resolution is an observation; the sequence below assigns it to retention, selectivity or efficiency before an experiment is chosen. It is a diagnostic order, not an optimization order.
- Verify tM and calculate k1 and k2 for the critical pair under isocratic conditions. If both are very low, retention is the first suspect.
- Calculate α from the adjusted retention times. If it is close to 1 with adequate retention, selectivity is the limitation and a change of chemistry is the experiment.
- If retention and selectivity are both adequate, measure the peak widths and calculate N for both peaks with a stated convention; inspect the asymmetry and the load.
- If N is far below what the column should deliver, decide whether the broadening is column-, method- or system-origin (Table 2): test the column on its reference conditions, measure the system variance, and vary load, injection solvent and flow rate.
- Recalculate k, α, N and Rs after each change; judge the experiment by the term it was meant to move.
- If the peaks are distorted, do not interpret N at all until the shape has been fixed.
Worked case: adequate retention and selectivity, low N
A critical pair has k1 = 4.5 and k2 = 5.4, so α = 5.4/4.5 = 1.20, yet the observed resolution is only 1.2 and both peaks are visibly broad. Neither retention nor selectivity is the limitation: with the selectivity term 0.20/1.20 = 0.167 and the retention term 5.4/6.4 = 0.844, a column of 10,000 plates would give Rs ≈ 25 × 0.167 × 0.844 ≈ 3.5. Solving the relationship for the plate number that produces Rs = 1.2 gives N ≈ (4 × 1.2 / (0.167 × 0.844))² ≈ 1,160, roughly a tenth of what the column should deliver. The informative experiments are those in step 4: if N recovers on the vendor’s test conditions, the method or the system is broadening the peaks; if it does not, the column is. Changing the chemistry here would waste a selectivity that is already sufficient.
What are the common errors with theoretical plates?
Table 5 lists the errors that recur in column comparisons and system-suitability records and the practice that avoids each.
| Error | Why it is wrong | Better practice |
|---|---|---|
| Comparing N between columns of different length | A longer column has more plates because it is longer | Compare H, or h = H/dp when particle sizes differ, under the same conditions |
| Mixing the base-width and half-height forms | The coefficients belong to different width definitions | State the convention with every value; use the one the applicable procedure prescribes |
| Treating N as a fixed column specification | Measured N depends on analyte, conditions and the instrument | Quote the test conditions; compare only like with like |
| Calculating N on a badly tailing peak | The Gaussian equations overestimate N for skewed peaks | Fix the shape first, or use the Foley–Dorsey form and report the asymmetry |
| Assuming a low N means bad packing | Method and system broaden peaks as effectively as a bad bed | Separate column, method and system origins before replacing the column |
| Applying a universal minimum plate count | Requirements are method-specific | Use the validated or compendial criterion for the method |
| Reading a gradient plate count as column efficiency | Gradient peak widths depend on the gradient program | Track it as a trend within one method only |
Frequently asked questions
What is the formula for theoretical plates in HPLC, and why are there two?
For a Gaussian peak, N = 16(tR/wb)² with the width at the base or N = 5.545(tR/wh)² with the width at half height; both equal N = (tR/σ)². Two coefficients exist because the two widths are different multiples of the standard deviation, 4σ and 2.355σ, and 16 and 8 ln 2 convert each back to the same N. The half-height form is easier to measure reproducibly and is the one the pharmacopeias prescribe, with the coefficient rounded to 5.54. The forms diverge for asymmetric peaks, so state the convention.
What is HETP in HPLC?
HETP, the height equivalent to a theoretical plate, is the plate height H = L/N: the column length divided by the plate number, in µm or mm. It is the efficiency per unit length, so it is the quantity that lets columns of different length be compared, and the reduced plate height h = H/dp extends the comparison across particle sizes. A well-packed column near its optimum flow rate gives h of roughly 2–3; a much larger value means the packing, the operating conditions or the instrument is losing efficiency. Lower H is better under comparable conditions.
Is a higher plate number always better?
Under comparable conditions a higher N means narrower peaks relative to retention, which is what efficiency means. But N alone does not decide whether a pair is resolved: resolution also depends on the separation factor and the retention factor, and efficiency enters only as √N, so doubling the plates gains 41%, not 100%, and doubling the column length to get them doubles the run time and pressure. More plates are worth having when the peaks are too wide for an adequate α; they are the wrong lever when α is close to 1.
What is a good theoretical plate count?
There is no universal value. Plate number depends on column length and particle size, on the analyte and its retention, on the operating conditions and on the instrument, and adequacy depends on what the method has to resolve. As orientation only, a 150 mm column of 5 µm particles typically delivers 10,000–15,000 plates for a well-retained analyte on a low-dispersion system, a 100 mm column of 1.7 µm particles 20,000–25,000, and a column that reads well below its own specification on the vendor’s conditions has a column, method or system fault that Table 3 sorts. Validated and compendial methods set their own minimum for named peaks, and that figure is the one that applies.
Does column length increase the number of theoretical plates?
Yes, in proportion, provided the plate height stays the same: N = L/H, so a 250 mm column has 2.5 times the plates of a 100 mm column of the same packing. It does not lower the plate height, so it does not make the column more efficient per unit length, and it multiplies the run time and the pressure drop by the same factor. On the resolution side the gain is √2.5 ≈ 1.58 for the efficiency term. Coupling columns, or moving to smaller particles at the same length, are the alternatives when more plates are genuinely what the separation needs.
Can extra-column volume lower the measured plate count?
Yes, and on modern columns it is often the dominant loss. The observed peak variance is the sum of the column’s and the instrument’s, from the injector, tubing, fittings, detector cell and data rate. The instrument’s contribution is roughly constant for a given system at a given flow rate and independent of the column, so it takes most from the smallest peaks: early eluters, short or narrow-bore columns, and sub-2 µm or core–shell packings, where it can hide half the plates the column would deliver on an optimized instrument. Swapping the column does not change it; shorter and narrower tubing, fewer fittings and a smaller flow cell do.
Does flow rate affect the plate number?
Yes. Plate height depends on the linear velocity through the mechanisms of the van Deemter relationship: eddy dispersion, roughly independent of velocity; longitudinal diffusion, which dominates at low velocity; and resistance to mass transfer, which grows with velocity. Their sum passes through a minimum at an optimum velocity, and a column run well above or below it reports fewer plates than its packing can deliver.13 Small particles flatten the curve and move the optimum to higher velocity, which is why sub-2 µm columns tolerate fast flow.7 A controlled flow-rate series is the direct test.
The takeaway
The plate number is a normalized peak width, N = 16(tR/wb)² = 5.545(tR/wh)², and the plate height H = L/N is the same information per unit column length. Both are measurements of a peak produced by the whole system under specific conditions, not constants of the column, and both are meaningless without the width convention that produced them. Efficiency enters resolution as √N, which makes it the term to pursue when the peaks are too wide for an adequate separation factor and the wrong term when the pair has α near 1. When a plate count is low, the productive question is not whether the column is bad but where the broadening comes from: the column, the method or the instrument. Answer that before changing anything else.
References
- IUPAC, “plate number, N“, Compendium of Chemical Terminology (the “Gold Book”), online version, DOI 10.1351/goldbook.P04694; from L. S. Ettre, Pure Appl. Chem. 65, 819 (1993).
- IUPAC, “plate height, H“, Compendium of Chemical Terminology (the “Gold Book”), online version, DOI 10.1351/goldbook.P04693.
- L. S. Ettre, “Nomenclature for chromatography (IUPAC Recommendations 1993)”, Pure Appl. Chem. 65(4), 819–872 (1993).
- J. P. Foley and J. G. Dorsey, “Equations for calculation of chromatographic figures of merit for ideal and skewed peaks”, Anal. Chem. 55(4), 730–737 (1983).
- L. R. Snyder, J. J. Kirkland and J. W. Dolan, Introduction to Modern Liquid Chromatography, 3rd ed., Wiley (2010).
- United States Pharmacopeia, General Chapter ⟨621⟩ Chromatography, USP–NF, DOI 10.31003/USPNF_M99380_01_01.
- F. Gritti and G. Guiochon, “Mass transfer kinetics, band broadening and column efficiency”, J. Chromatogr. A 1221, 2–40 (2012).
- S. Fekete and J. Fekete, “The impact of extra-column band broadening on the chromatographic efficiency of 5 cm long narrow-bore very efficient columns”, J. Chromatogr. A 1218(31), 5286–5291 (2011).
- F. Gritti and G. Guiochon, “On the extra-column band-broadening contributions of modern, very high pressure liquid chromatographs using 2.1 mm I.D. columns packed with sub-2 µm particles”, J. Chromatogr. A 1217(49), 7677–7689 (2010).
- F. Gritti and G. Guiochon, “Accurate measurements of the true column efficiency and of the instrument band broadening contributions in the presence of a chromatographic column”, J. Chromatogr. A 1327, 49–56 (2014).
- IUPAC, “effective theoretical plate number, Neff“, Compendium of Chemical Terminology (the “Gold Book”), online version, DOI 10.1351/goldbook.E01898.
- L. R. Snyder and J. W. Dolan, High-Performance Gradient Elution: The Practical Application of the Linear-Solvent-Strength Model, Wiley (2007), DOI 10.1002/0470055529.
- J. J. van Deemter, F. J. Zuiderweg and A. Klinkenberg, “Longitudinal diffusion and resistance to mass transfer as causes of nonideality in chromatography”, Chem. Eng. Sci. 5(6), 271–289 (1956).
Reviewed against primary sources. Every equation, definition and threshold on this page is checked against the IUPAC Gold Book and the 1993 IUPAC recommendations on chromatographic nomenclature and against the primary literature cited above; USP General Chapter ⟨621⟩ is cited for its plate-number convention and for the precedence of compendial criteria. Numerical examples are illustrative calculations from the equations stated and are not method-development predictions or acceptance criteria. For validated or compendial methods, the applicable procedure and regulatory framework take precedence over the general rules of thumb given here. Evidence review: September 2026.