
Phospholipid interference in LC-MS/MS happens when phospholipids carried through sample preparation co-elute with an analyte and change its ionization. In a quantitative assay this can shift analyte and internal-standard responses, widen lot-to-lot variability or bias results. A phospholipid marker at the analyte retention time is a clue; it does not establish the cause.
Locate the response abnormality, test whether it coincides with lipid-rich eluate, quantify the matrix effect, change one controllable factor, then verify the complete assay. Phospholipids are one possible source of matrix effects, especially in plasma and other lipid-rich biological extracts, and neither all phospholipid classes nor all ionization modes behave alike.
What does phospholipid interference look like in LC-MS/MS?
Phosphatidylcholines and related glycerophosphocholines produce a characteristic phosphocholine ion at m/z 184 in positive-ion electrospray ionization (ESI), which can be monitored by a precursor-ion scan or by in-source fragmentation with m/z 184 → 184 selected reaction monitoring.1–3 Other classes need other channels: one comparison of monitoring techniques combined a positive precursor-ion scan of m/z 184, a positive neutral-loss scan of 141 Da and a negative precursor-ion scan of m/z 153.3 These are class-associated monitoring signals under suitable acquisition conditions, not universal detectors for every phospholipid. Check the instrument method, collision conditions and chromatographic range, and do not read a small or absent m/z 184 signal as proof that the extract has no matrix effects.2–4
Elution position matters as well as amount. In reversed-phase separations, the earlier-eluting lysophospholipids can be more likely to cause matrix effects than the later-eluting phospholipids, despite the larger plasma concentrations of the latter; ionization mode also changes the picture, since suppression in ESI and enhancement in atmospheric-pressure chemical ionization (APCI) have both been associated with monitored phospholipids.3,4
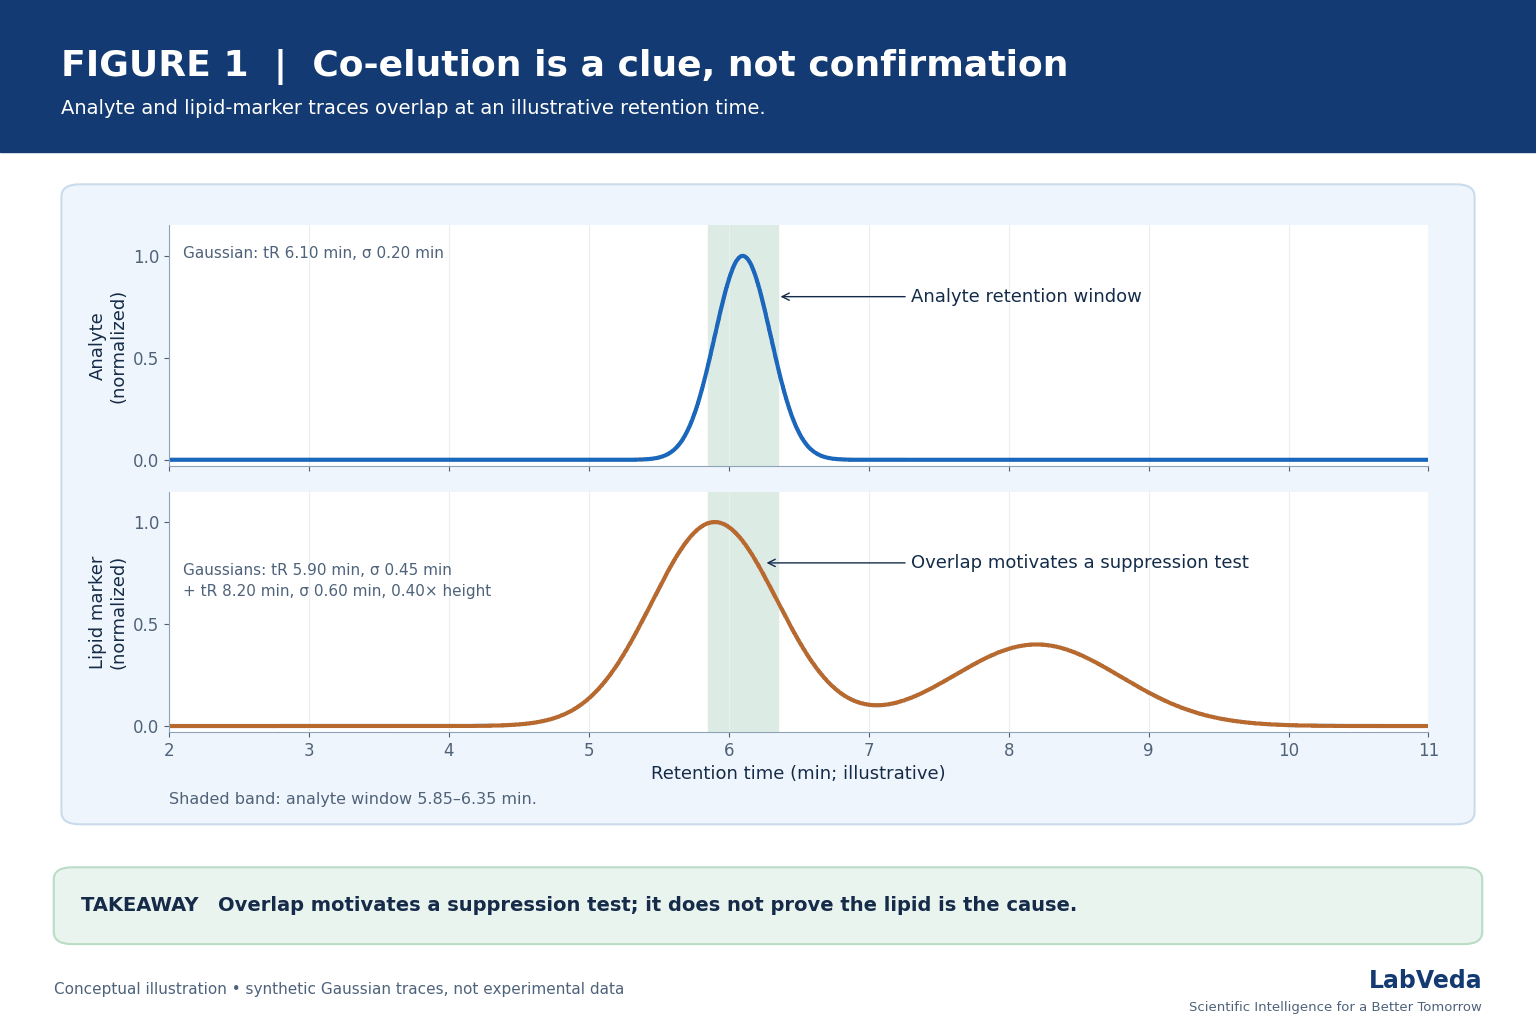
The key observation is whether the analyte elutes within a region in which matrix injection depresses or enhances an infused analyte signal. Lipid-marker overlap increases suspicion; it does not distinguish a lipid cause from another co-eluting constituent. A targeted cleanup or separation experiment strengthens attribution if the lipid marker and the measured effect change together while the analyte remains adequately recovered.2–4 Figure 1 shows the overlap that should prompt a suppression test.
LC-MS PK Peak Integrity Engine
Interrogate carryover, matrix effects, ion suppression, and integration integrity before your PK data goes to QC.
How do you confirm phospholipid-related ion suppression?
First inspect chromatograms, integration, retention time, analyte and internal-standard (IS) areas, calibration residuals and quality control (QC) behavior. Compare a neat standard with a post-extraction spike at the same nominal concentration in extracted blank matrix. Use several independent lots appropriate to the intended assay; evaluate the IS separately, and the analyte/IS normalized response when quantitation relies on it. The post-extraction comparison estimates the ionization matrix effect for that experiment. The exact design and acceptance criteria depend on the method and its regulatory context.5,6
Next, perform post-column infusion: introduce a steady analyte stream after the column while injecting extracted blank matrix. A dip or rise in the infused analyte trace maps a time region of suppression or enhancement. Overlay the analyte retention window and a lipid-monitor trace acquired under suitable conditions. Infusion localizes the effect but does not on its own quantify sample-to-sample bias or identify the suppressing molecule. Follow with matched post-extraction spikes and, if indicated, an orthogonal change to cleanup or separation.2–5 Figure 2 shows how a response dip and a lipid signal line up in time.
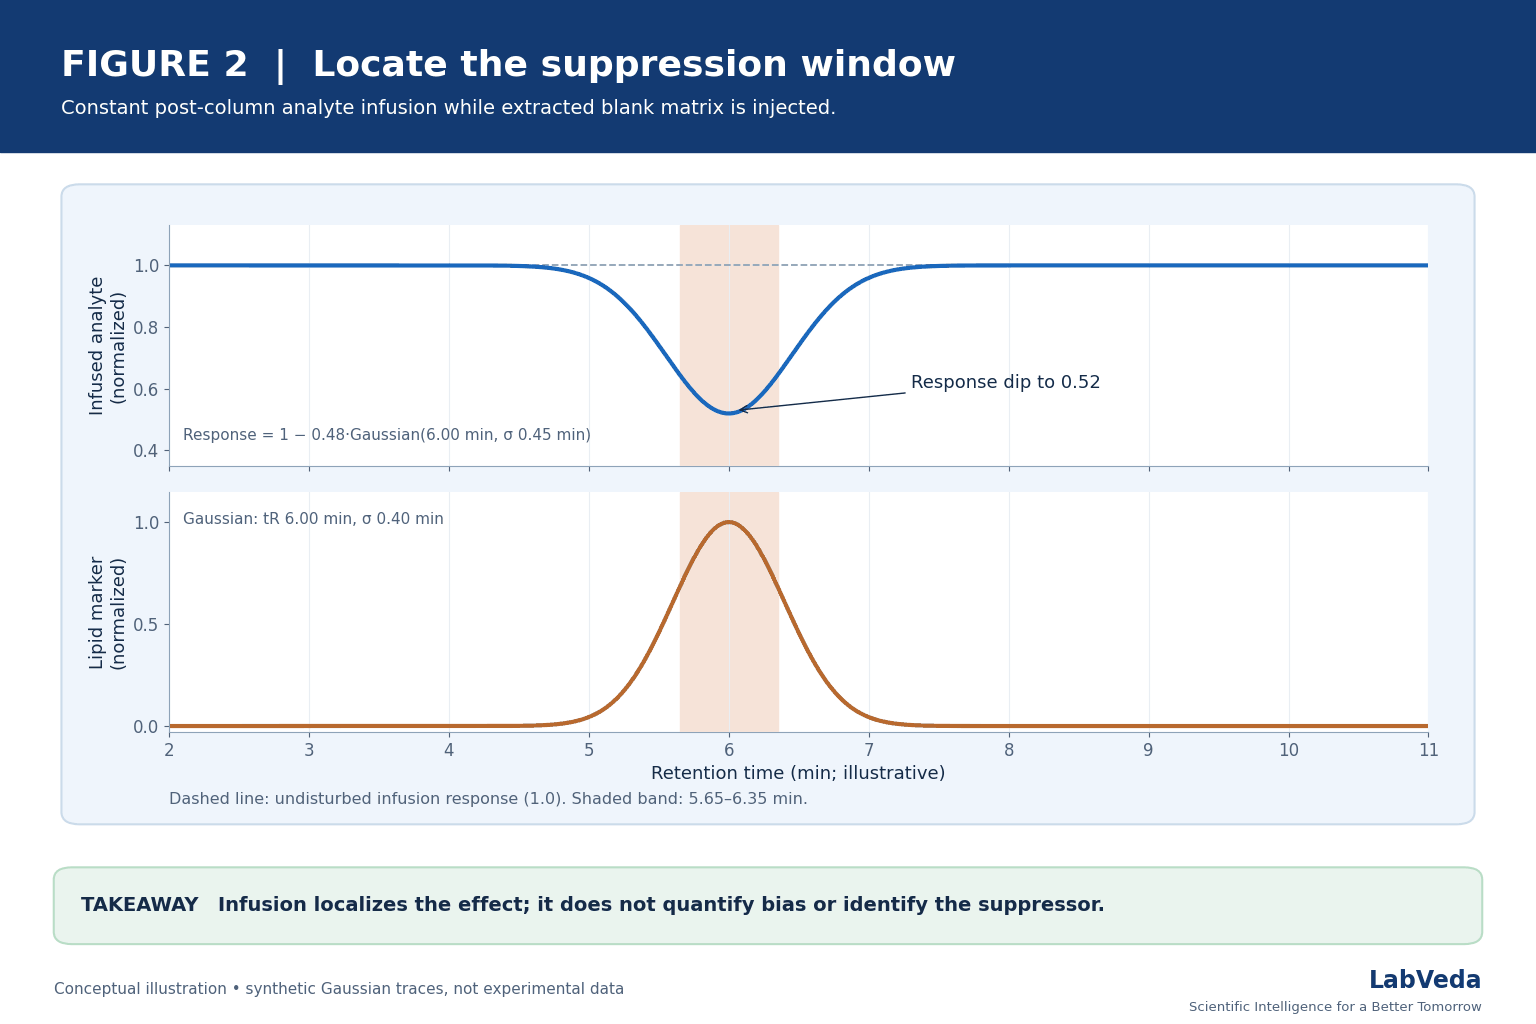
Table 1 matches each experiment to the question it answers and the limit on what it can show.
| Experiment | Controlled comparison | What it supports | Important limit |
|---|---|---|---|
| Lipid-class monitoring | Extract versus blank and across preparation methods | Location and relative change of monitored lipid classes | Selected channels do not cover all phospholipids or prove causation |
| Post-column analyte infusion | Constant analyte infusion during blank-matrix injection | Time region of ion suppression or enhancement | Qualitative localization; response depends on the setup |
| Post-extraction spike | Matched neat and extracted-blank spikes | Ionization matrix factor for the tested matrix and concentration | Does not measure extraction recovery |
| Pre-extraction versus post-extraction spike | Equal nominal additions before versus after extraction | Extraction recovery under the tested conditions | Recovery and matrix effect must remain separate |
| Independent matrix lots with analyte and IS | Same method across representative lots | Between-lot variability and suitability of IS correction | One lot or one analyte cannot establish universal robustness |
How do you separate matrix effect from extraction recovery?
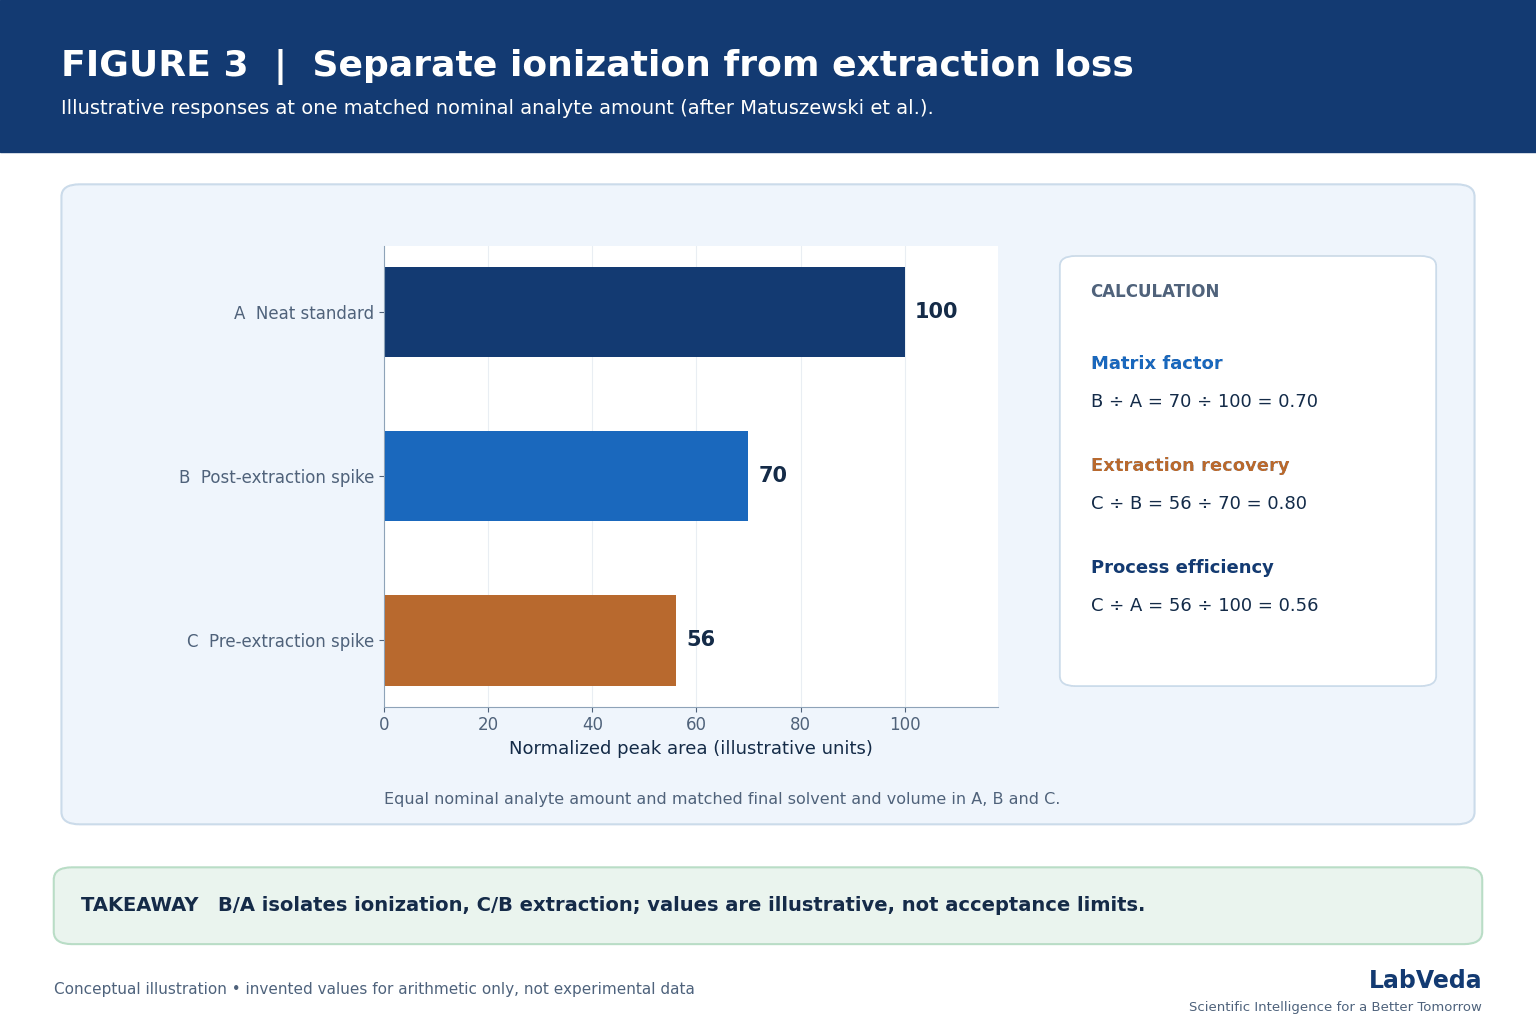
Use the three-set design described by Matuszewski and colleagues, with an equal nominal analyte amount and matched final solvent and volume. Set A is a neat standard, set B is a post-extraction spike into extracted blank matrix and set C is a pre-extraction spike processed through the complete method. Compare areas or responses under a consistent definition; when using an IS ratio, state where the IS is added and keep that timing consistent with the intended calculation.5 The three quantities are:
Matrix factor = B / A
Extraction recovery = C / B
Process efficiency = C / A
where A, B and C are the mean responses of the three sets. With illustrative responses A = 100, B = 70 and C = 56, the matrix factor is 70 / 100 = 0.70, extraction recovery is 56 / 70 = 0.80 and process efficiency is 56 / 100 = 0.56; the last equals 0.70 × 0.80. Table 2 lays out the calculation, and the full treatment of the design is in the LC-MS ion suppression and matrix effects guide.
| Quantity | Calculation | Illustrative result | Interpretation |
|---|---|---|---|
| A, neat response | Defined reference | 100 | Same nominal analyte amount |
| B, post-extraction spike | Measured in extracted blank matrix | 70 | Matrix-associated response reduction in this comparison |
| C, pre-extraction spike | Measured after complete preparation | 56 | Combined preparation and matrix effect |
| Matrix factor | B / A | 0.70 | 30% lower response than neat in this illustrative example |
| Extraction recovery | C / B | 0.80 | 80% recovery relative to the post-extraction spike |
| Process efficiency | C / A | 0.56 | Combined effect, not a standalone recovery measurement |
A low extraction recovery does not prove lipid interference, and a small absolute matrix effect does not guarantee acceptable between-lot variability. Evaluate the analyte and the IS as the assay requires.5 Figure 3 shows the same three responses and ratios.
How do you remove phospholipids from plasma extracts?
Compare preparation methods experimentally. Protein precipitation is convenient but may carry appreciable lipids into the extract. Liquid-liquid extraction, solid-phase extraction (SPE) and selective phospholipid-removal products can reduce particular lipid classes under suitable conditions; in one plasma study, combining mixed-mode anion- and cation-exchange SPE cartridges removed more phospholipids and reduced matrix effects compared with a single polymeric reversed-phase cartridge. Performance depends on analyte chemistry, matrix, protocol and sorbent, and selective removal may also lose analyte or change recovery. Compare representative blank lots, analyte recovery, matrix factor, process efficiency and reproducibility under matched conditions; do not treat any one cleanup approach as universally superior.3,5,7
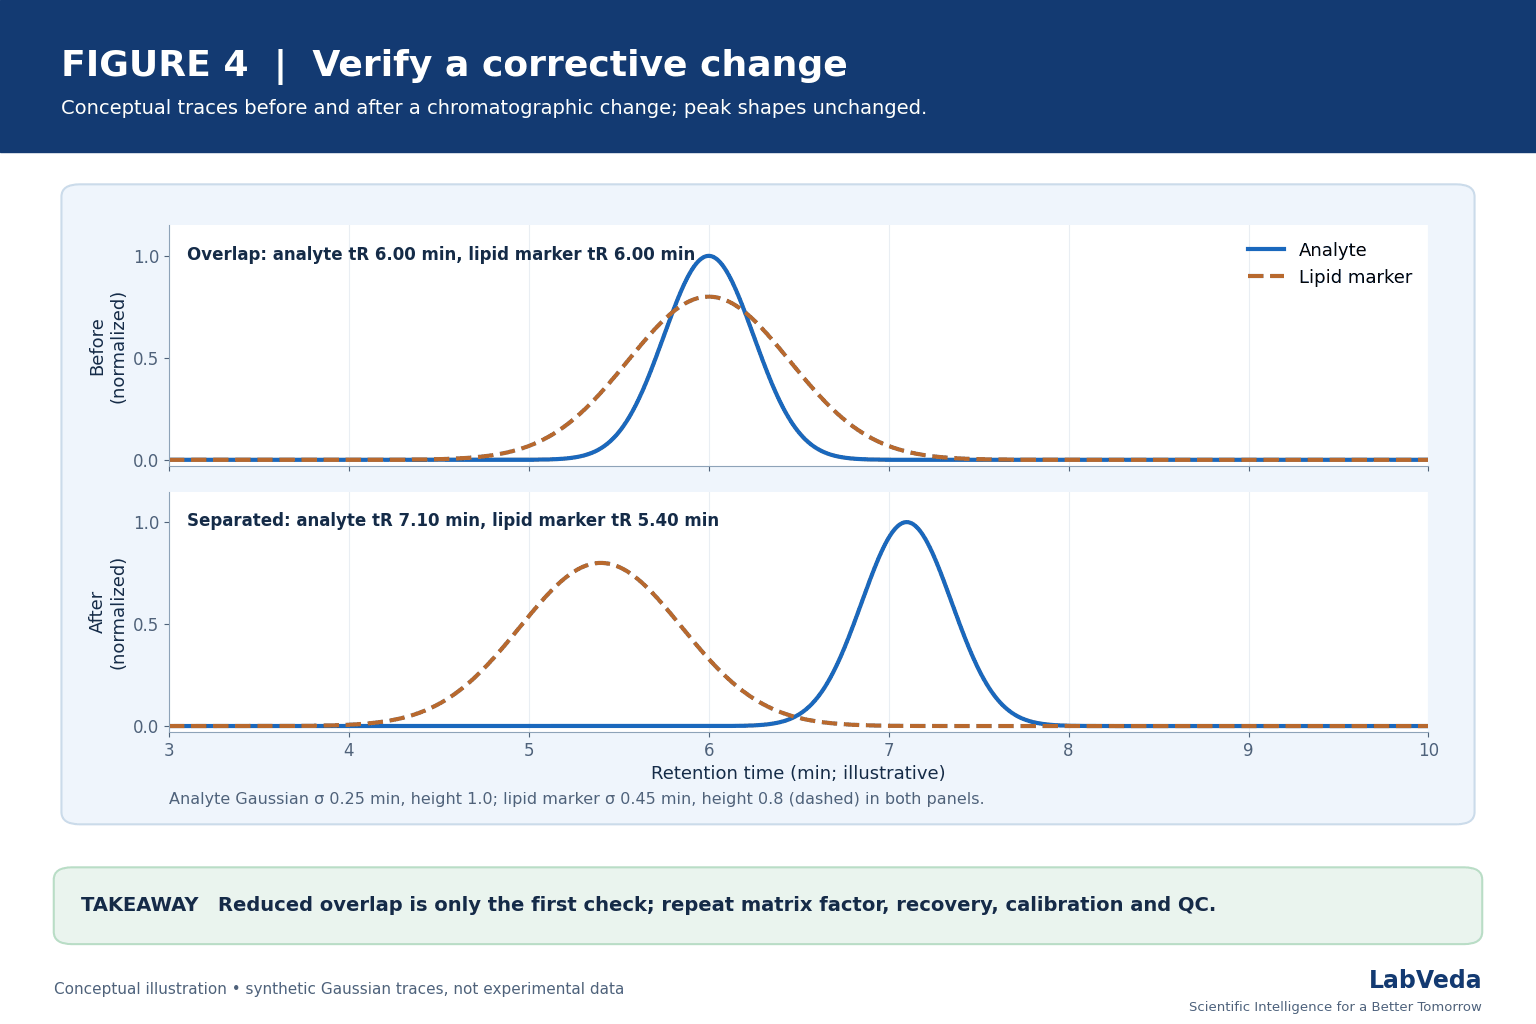
Improve separation. Adjust the gradient, stationary phase or retention so the analyte reaches the source outside the identified suppression window. Check the full gradient and wash, because retained lipids can elute late or in a following injection, much like carryover from a preceding injection. Moving retention may also move the analyte into a different interference region, so remap the response after every change.2,3
Check the IS and injection conditions. A stable-isotope-labeled IS that co-elutes and shares relevant chemistry can improve correction, but it cannot be assumed to compensate perfectly for a nonuniform suppression region, imperfect co-elution or different extraction behavior. Assess both absolute and IS-normalized results. A smaller injection load or justified dilution may reduce the matrix burden, but confirm that the analyte stays within the validated range and that dilution integrity and sensitivity remain suitable.6 Figure 4 shows a separation change and why it is only the first check.
How do you verify a phospholipid fix?
Run the revised method against independent matrix lots and relevant QC levels. Recheck analyte and IS areas, matrix effect, extraction recovery, process efficiency, accuracy and precision where applicable, selectivity (including qualifier/quantifier ion ratios where the method uses them), carryover and any stability affected by the change. Inspect the full sequence for late lipid elution and source contamination. In regulated bioanalysis, apply the current ICH M10, Bioanalytical Method Validation and Study Sample Analysis (Step 4, 24 May 2022), expectations to the specific assay and to the validation or partial-validation change; the guideline is not a universal rule for all LC-MS applications.6 Record the original observation, lot and preparation details, test conditions, intervention, results and review decision. Table 3 routes each observation to its most useful next comparison.
| Observation | Plausible explanations | Most useful next comparison |
|---|---|---|
| Lipid marker overlaps analyte; infused analyte dips | Lipid-associated or other co-eluting matrix effect | Compare matched extracts before and after a lipid-reducing or chromatographic change |
| Lipid marker overlaps; no infusion dip | Marker may be present without appreciable effect for this analyte and setup | Quantify post-extraction matrix factors across lots; do not assign cause from overlap |
| No selected lipid marker; infusion dip persists | Unmonitored lipid or other matrix constituent | Broaden the survey and compare cleanup and chromatography; assess other co-eluting species |
| Pre-extraction response low; post-extraction response close to neat | Extraction loss or instability is plausible | Compare C/B recovery and sample-handling controls |
| Analyte and IS responses change differently | Differential matrix or preparation behavior | Examine retention alignment, IS timing and lot-specific normalized matrix effects |
Frequently asked questions
Does an m/z 184 peak prove phospholipid suppression?
No. An m/z 184 signal supports the presence of monitored phosphocholine-containing species under the acquisition conditions used; it does not show that those species change the analyte response. Demonstrate an analyte response effect with post-column infusion and matched post-extraction spikes, then test whether a cleanup or chromatographic intervention changes the lipid signal and the effect together.2–4
Can I rely on post-column infusion alone?
No. Post-column infusion localizes a potential effect in chromatographic time, but it does not quantify sample-to-sample bias or identify the suppressing molecule. Use post-extraction spikes across relevant matrix lots to quantify the effect and to evaluate how well the IS corrects it, and keep extraction recovery as a separate measurement.5,6
Which sample preparation removes phospholipids best?
No single approach is best for every assay. Protein precipitation is quick but can leave appreciable lipids in the extract; liquid-liquid extraction, SPE and selective phospholipid-removal products can reduce particular lipid classes, but performance depends on analyte chemistry, matrix, protocol and sorbent. Compare candidates on representative blank lots for matrix factor, recovery, process efficiency and reproducibility under matched conditions.3,7
Will a stable-isotope-labeled internal standard correct phospholipid suppression?
Often it improves correction, but it cannot be assumed to compensate perfectly. A co-eluting stable-isotope-labeled IS shares much of the analyte’s ionization environment; a nonuniform suppression region, imperfect co-elution or different extraction behavior can still leave a bias. Assess both absolute and IS-normalized matrix factors across independent lots before relying on the correction.6
Does phospholipid removal solve every matrix effect?
No. Other matrix constituents may co-elute with the analyte, and a cleanup step can itself reduce analyte recovery or change process efficiency. After any cleanup change, verify the complete assay: matrix factor across lots, recovery, calibration, QC accuracy and precision, selectivity and carryover, and document the result under the governing procedure.3,5,7
The takeaway
Treat a phospholipid marker at the analyte retention time as a reason to test, not a conclusion. Localize the effect with post-column infusion, quantify it with matched post-extraction spikes across independent lots, keep extraction recovery separate from ionization, then change one factor at a time — sample preparation, separation, IS or injection load — and verify the complete assay after the change. No cleanup product, internal standard or single lipid channel removes the need for that verification.
References
- J. L. Little, M. F. Wempe, C. M. Buchanan, “Liquid chromatography–mass spectrometry/mass spectrometry method development for drug metabolism studies: Examining lipid matrix ionization effects in plasma,” J. Chromatogr. B 833(2), 219–230 (2006). doi:10.1016/j.jchromb.2006.02.011.
- O. A. Ismaiel, M. S. Halquist, M. Y. Elmamly, A. Shalaby, H. T. Karnes, “Monitoring phospholipids for assessment of matrix effects in a liquid chromatography–tandem mass spectrometry method for hydrocodone and pseudoephedrine in human plasma,” J. Chromatogr. B 859(1), 84–93 (2007). doi:10.1016/j.jchromb.2007.09.007.
- Y.-Q. Xia, M. Jemal, “Phospholipids in liquid chromatography/mass spectrometry bioanalysis: comparison of three tandem mass spectrometric techniques for monitoring plasma phospholipids, the effect of mobile phase composition on phospholipids elution and the association of phospholipids with matrix effects,” Rapid Commun. Mass Spectrom. 23, 2125–2138 (2009). doi:10.1002/rcm.4121.
- O. A. Ismaiel, M. S. Halquist, M. Y. Elmamly, A. Shalaby, H. T. Karnes, “Monitoring phospholipids for assessment of ion enhancement and ion suppression in ESI and APCI LC/MS/MS for chlorpheniramine in human plasma and the importance of multiple source matrix effect evaluations,” J. Chromatogr. B 875, 333–343 (2008). doi:10.1016/j.jchromb.2008.08.032.
- B. K. Matuszewski, M. L. Constanzer, C. M. Chavez-Eng, “Strategies for the assessment of matrix effect in quantitative bioanalytical methods based on HPLC-MS/MS,” Anal. Chem. 75(13), 3019–3030 (2003). doi:10.1021/ac020361s.
- ICH, M10 Bioanalytical Method Validation and Study Sample Analysis, Step 4 guideline (24 May 2022).
- F. Janusch, L. Kalthoff, G. Hamscher, S. A. I. Mohring, “Evaluation and subsequent minimization of matrix effects caused by phospholipids in LC–MS analysis of biological samples,” Bioanalysis 5(17), 2101–2114 (2013). doi:10.4155/bio.13.187.
Reviewed against primary sources. Every definition and claim on this page is checked against Matuszewski et al., ICH M10 and the primary phospholipid-monitoring and cleanup studies cited above. Numerical examples are illustrative calculations from the equations stated and are not acceptance criteria; the figures are conceptual illustrations, not experimental data. For validated or compendial methods, the applicable procedure and regulatory framework take precedence over the general rules of thumb given here. Evidence review: September 2026.