
HPLC resolution (Rs) describes how well two chromatographic peaks are separated relative to their widths. A higher Rs means less overlap between adjacent peaks, but the number alone does not explain why a separation is good or poor. The practical question in method development is which term is limiting it: efficiency, separation factor, retention, peak shape or the system itself.
For two adjacent peaks measured at baseline width, resolution is defined as:1
Rs = 2(tR2 − tR1) / (wb1 + wb2)
- tR1, tR2 = retention times of the first and second peak
- wb1, wb2 = baseline widths of the first and second peak (same units as tR)
A widely used approximate relationship then separates resolution into three contributions: column efficiency (N), separation factor (α) and retention factor (k).2–4 It is a method-development model rather than an exact predictor for every chromatogram, but it tells you what to change when two peaks will not separate. The rest of this guide works through the definition, what an Rs value means, how each of the three terms behaves, and how to decide which experiment to run.
See also: how chromatography works, the parent guide to retention, selectivity, efficiency and resolution.
Chromatography Troubleshooting Decision Engine
Any HPLC symptom, one starting point — the engine narrows hundreds of failure modes to the few that fit your evidence.
Quick diagnostic guide: what is limiting resolution?
Poor resolution is an observation, not a root cause. Start from what the chromatogram shows: Table 1 matches the observation to the likely limiting factor and the first variables to investigate.
| Observation | Likely limiting factor | First variables to investigate |
|---|---|---|
| Peaks are close together but individually sharp | Separation factor (α) | Stationary phase, mobile-phase composition, pH, temperature |
| Peaks are broad | Efficiency (N) | Column condition, particle size, flow rate, extra-column dispersion |
| Peaks elute close to the hold-up time | Retention (k) | Mobile-phase strength, gradient conditions |
| Peaks tail or front | Peak shape: overload or secondary interaction | Sample load, sample solvent, column chemistry, column condition |
| Resolution changed after method transfer | System or gradient differences | Dwell volume, extra-column volume, gradient delivery |
| Only one critical pair fails | Usually separation factor | Conditions that change relative retention |
What is resolution in HPLC?
Chromatographic resolution expresses the separation between two peaks relative to their average width at base.1,2 In the defining equation, the numerator is the distance between the peak maxima and the denominator the sum of the baseline widths. Two peaks with quite different retention times can still be poorly resolved if they are broad; closely spaced peaks can be well resolved if they are narrow. Retention-time difference alone is not a measure of separation.
Note the width convention. USP General Chapter ⟨621⟩ gives the baseline-width form used here and an equivalent half-height form, Rs = 1.18(tR2 − tR1) / (wh1 + wh2).2,5 The two agree for Gaussian peaks, but for a tailing peak the tangent baseline width is inflated by the tail while the half-height width is not, so the half-height form returns a higher Rs. Mixing conventions between runs, or between your data system and a compendial procedure, changes the number you report.
Worked example: calculating HPLC resolution
Suppose two peaks have tR1 = 5.20 min, tR2 = 5.80 min, wb1 = 0.30 min and wb2 = 0.34 min.
Rs = 2(5.80 − 5.20) / (0.30 + 0.34) = 1.20 / 0.64 = 1.875 ≈ 1.88
The calculation is straightforward. Interpreting the result requires more care.
What does an Rs value mean?
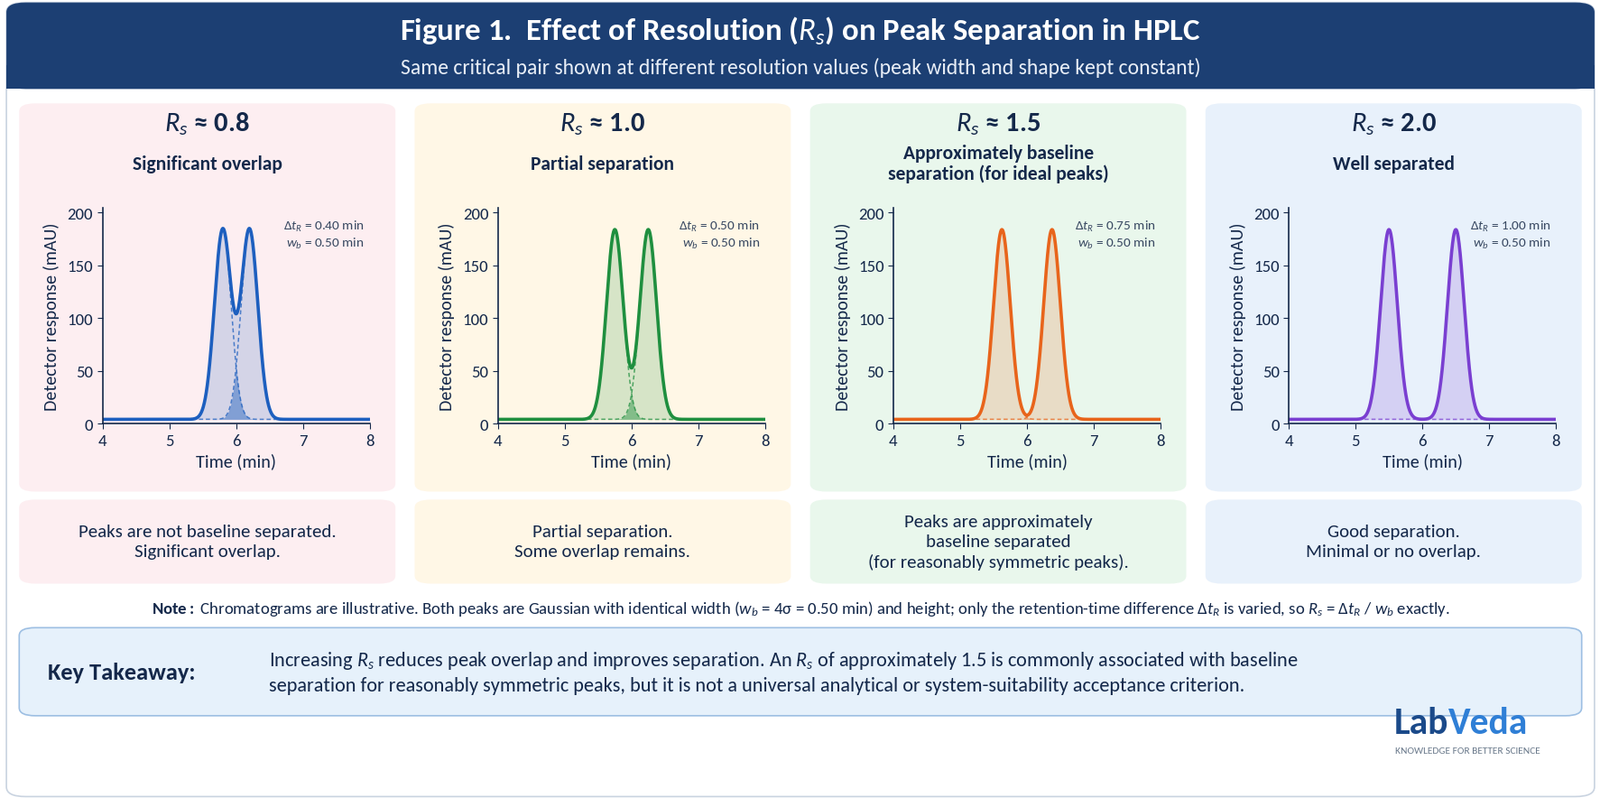
For approximately symmetric peaks of similar size, increasing Rs corresponds to progressively less overlap. A value around 1.5 gives essentially baseline separation for an ideal Gaussian pair: the valley sits at about 2% of peak height with roughly 0.1% of each peak’s area beyond it. Dolan notes that because the valley only just reaches the baseline at 1.5, any column deterioration or tailing makes the separation inadequate, and recommends Rs ≈ 2 as a practical target with a safety margin.6 Ref 7 shows the same erosion from the plate-number side: a pair at Rs = 2.0 on a fresh column drops below 1.5 as N falls.7 Table 2 summarizes the practical reading of an Rs value.
| Resolution | Practical interpretation (symmetric peaks of similar size) |
|---|---|
| Rs < 1.0 | Substantial overlap; below Rs ≈ 0.5 two equal Gaussian peaks no longer show two maxima |
| Rs ≈ 1.0 | Partial separation; the valley is about 27% of peak height |
| Rs ≈ 1.5 | Approximately baseline separation for reasonably symmetric peaks; valley about 2% of peak height |
| Rs ≥ 2.0 | Baseline separation (valley below 0.1%) with a margin for column aging and peak tailing |
The values in Table 2 are interpretive guides, not universal acceptance criteria. A procedure may require more or less resolution depending on peak asymmetry, relative peak size, integration settings, impurity levels and the quantitative objective. USP ⟨621⟩ provides the chromatographic definitions and general system-suitability requirements; the specific acceptance criterion is set in the applicable validated or compendial procedure.5
Figure 1 shows the same critical pair at four Rs values. Peak width and shape are held constant so that only the effect of peak spacing is visible. Real chromatograms behave differently when the two peaks differ in width, asymmetry, concentration or detector response.
What factors affect resolution in HPLC?
For an isocratic separation, under the assumptions used to derive it (closely spaced peaks of comparable efficiency), the approximate fundamental resolution relationship first set out by Purnell is:3,4,8
Rs ≈ (√N / 4) × ((α − 1) / α) × (k2 / (1 + k2))
| Parameter | Meaning | Mathematical contribution |
|---|---|---|
| N | Efficiency (theoretical plate number, of the second peak) | √N |
| α | Separation factor | (α − 1) / α |
| k | Retention factor (of the second peak) | k / (1 + k) |
The three terms (Table 3) behave differently, which is why identifying the limiting term is more useful than asking which parameter “improves resolution”.
1. Column efficiency (N)
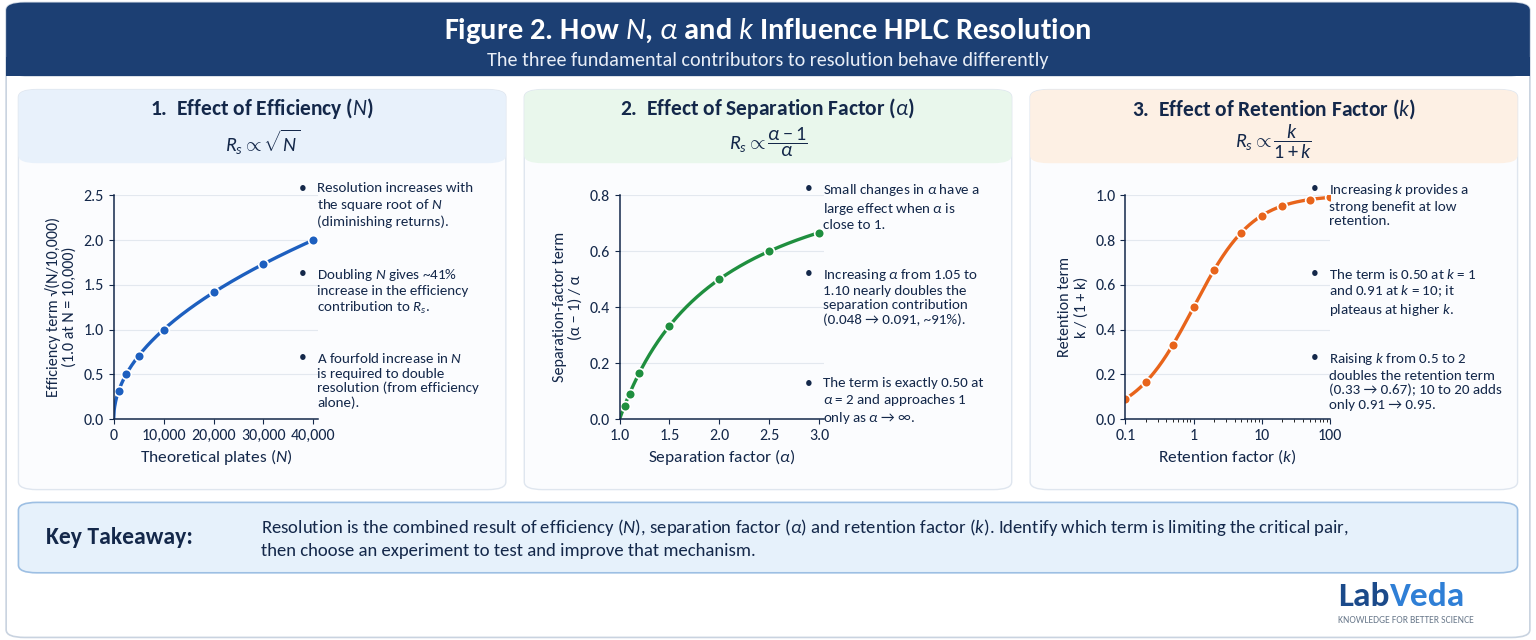
Efficiency describes how well the system limits band broadening and is expressed as the theoretical plate number N.2,4 Because Rs ∝ √N, efficiency gives diminishing returns. Doubling N from 10,000 to 20,000 raises the efficiency contribution by √2 ≈ 1.414, about 41%. Doubling resolution through efficiency alone requires a fourfold increase in N. A longer column is therefore often an inefficient answer to a selectivity problem.4,8
Column efficiency is also not system efficiency. A high-efficiency column cannot deliver its intrinsic performance if band broadening occurs in the injector, tubing, fittings or detector cell, or from a sample-solvent mismatch. The chromatogram reflects observed system performance, and the distinction matters most with narrow-bore columns, sub-2 µm particles and low-dispersion UHPLC; the HPLC theoretical plates and HETP guide covers how N is calculated and how to separate column, method and system broadening.
2. Separation factor (α)
For two adjacent peaks IUPAC defines the separation factor as α = k2/k1, with k2 > k1 so that α > 1.2,9 IUPAC notes the term is sometimes called “selectivity” and discourages that usage, although “selectivity factor” remains common in the literature and at the bench.9 The HPLC separation factor guide covers the calculation, the selectivity term and the variables that change α in reversed-phase HPLC.
When α is close to 1, small changes have a large effect on the (α − 1)/α term:
α = 1.05: (1.05 − 1)/1.05 = 0.0476 α = 1.10: (1.10 − 1)/1.10 = 0.0909 ratio = 1.91
Increasing α from 1.05 to 1.10 raises the separation-factor contribution by about 91% under this model. That does not mean every mobile-phase change increases total Rs by 91%; it shows why changing relative retention gives so much leverage when the critical pair has α close to unity.3,4,8 Stationary-phase chemistry, organic modifier identity, mobile-phase composition, pH, buffer, temperature and ion-pairing or other secondary interactions all change α. The objective is not to move both peaks but to move them differently: if both shift by nearly the same relative amount, retention times change while α, and resolution, barely move.
3. Retention factor (k)
IUPAC defines the retention factor as the ratio of adjusted retention time to hold-up time, k = (tR − tM)/tM.2,10 The current symbol is k; older literature uses k′ and the names capacity factor or capacity ratio.10 The full treatment, from measuring it to what the value means for the critical pair, is in the HPLC retention factor guide. (How to measure tM is covered in the column void volume guide.) Table 4 tabulates the retention term k/(1 + k) across the working range of k.
| k | k / (1 + k) |
|---|---|
| 0.5 | 0.333 |
| 1 | 0.500 |
| 2 | 0.667 |
| 5 | 0.833 |
| 10 | 0.909 |
| 20 | 0.952 |
Table 4 shows that at low k, increasing retention gives a substantial resolution benefit. At higher k the term approaches 1 and the incremental benefit becomes small, so making an already well-retained pair elute much later adds run time without a proportional gain in resolution.3,4,8
N, α or k: which matters most for the critical pair?
There is no universal answer. The right question is which term is limiting the critical pair: the two peaks whose separation constrains the method. That is often an analyte and a specified impurity, two impurities requiring independent quantitation, an analyte and a matrix interference, a degradation product and the parent, or an internal standard and an endogenous component. Identify the critical pair from analyte identity and analytical purpose, not from whichever two peaks happen to be closest on one chromatogram, because changing selectivity can change the elution order.
Consider a hypothetical pair with N = 10,000, α = 1.05 and k = 5, which the relationship above puts at Rs = 25 × 0.0476 × 0.833 ≈ 0.99. Three single changes give very different theoretical returns (Table 5):
| Change | Term before → after | Relative change in that term |
|---|---|---|
| A. Double N (10,000 → 20,000) | √N: 100 → 141 | ×1.41 (≈ +41%) |
| B. Increase k from 5 to 10 | k/(1 + k): 0.833 → 0.909 | ×1.09 (≈ +9%) |
| C. Increase α from 1.05 to 1.10 | (α − 1)/α: 0.0476 → 0.0909 | ×1.91 (≈ +91%) |
Table 5 makes the point: because retention is already substantial while α is close to 1, the separation factor offers far more leverage than more retention, and more than doubling the plate count: change C alone takes the pair from Rs ≈ 0.99 to ≈ 1.89, from partial to baseline separation.3,4,8 The ranking is specific to this starting point: with broad peaks, band broadening comes first; with k below about 1, retention comes first (Figure 2). It is an illustrative model calculation, not a universal ranking of strategies.
How do you improve HPLC resolution?
Match the corrective action to the mechanism the chromatogram points to. Table 6 extends the quick guide in Table 1 with the diagnostic test that discriminates each mechanism and the corrective action that follows.
| Problem | Likely mechanism | Diagnostic test | Corrective action |
|---|---|---|---|
| Two sharp peaks too close together | Low α | Change one chemistry-sensitive variable and look for differential movement | Stationary phase, organic modifier, mobile-phase composition, pH, temperature |
| Broad peaks | Low observed efficiency | Compare plate count and width against the column’s expected performance | Column condition, flow rate, column dimensions, particle size, tubing and fittings, detector volume, injection volume, sample solvent |
| Peaks elute near the hold-up time | Low k | Measure tM and calculate k | Weaken the mobile phase or adjust initial gradient conditions while monitoring selectivity |
| Tailing critical pair | Peak-shape defect, not low resolution | Evaluate asymmetry; injection-volume and concentration study | Correct overload, sample-solvent mismatch, secondary interactions, pH, active sites, contamination, extra-column effects (see the peak shape guide and the peak tailing diagnostic path) |
| Resolution lost after method transfer | System or gradient difference | Compare dwell and extra-column volumes | Adjust transfer conditions (see below) |
| Resolution slowly deteriorates | Column or system deterioration | Trend efficiency and peak shape over time | Clean or replace the column; inspect the system |
| Resolution varies with load | Overload or non-linearity | Injection-volume and concentration study | Reduce mass on column or injection volume |
A poor-resolution decision sequence
- Confirm the problem is real. Check integration, peak identity, injection reproducibility and data-processing settings.
- Classify the observation. Are the peaks sharp and symmetric, or broad, tailing or fronting? Are they retained sufficiently away from the hold-up region? Are two otherwise good peaks simply too close?
- Hypothesize the limiting mechanism: retention, separation factor, efficiency, peak shape or system behavior.
- Change one variable capable of discriminating between the plausible causes.
- Measure Rs, k, α, efficiency and peak shape for the critical pair.
- Verify the improvement across replicates and relevant method conditions.
- Only then optimize robustness, run time, solvent consumption and transfer performance.
Worked diagnosis: narrow peaks with Rs = 0.9
Observation: two peaks are narrow and adequately retained (k ≈ 2–10) but Rs = 0.9. Interpretation: efficiency is probably adequate; insufficient relative retention is the stronger hypothesis. Discriminating experiment: change one selectivity-sensitive variable, such as the organic modifier, pH or stationary-phase chemistry. Expected evidence: differential movement of the two peaks rather than an equal shift in both retention times. Next action: optimize the condition that increases α while preserving peak shape, retention and robustness. This is more informative than the instruction to “increase resolution”.
Does column length, particle size or flow rate improve resolution?
Column length
Usually yes: with the same particle size, packing quality and flow rate, plate number scales with column length and Rs ∝ √N.4 But doubling N raises the efficiency term by only about 41%, while run time and backpressure double at the same flow rate. It should not be the first response to a selectivity-limited separation.
Particle size
Smaller particles reduce band broadening and allow efficient operation at higher linear velocity, within the pressure capability of the system. Efficiency does not replace selectivity: if α ≈ 1, even a highly efficient column may fail to resolve the pair.
Flow rate
Flow rate affects observed N through band broadening, so an inappropriate linear velocity costs resolution. It has far less leverage than separation factor when two sharp, adequately retained peaks have nearly identical relative retention.
How do peak shape and asymmetry affect resolution?
The conventional Rs equation includes peak width but does not fully describe the consequences of severe asymmetry. Tailing, fronting, unequal widths and large differences in peak size can make a single Rs value a poor guide to how difficult the two components are to quantify; Song and Wang proposed a modified resolution factor specifically for asymmetric peaks.11 This is one more reason never to interpret Rs without looking at the chromatogram.
Why is gradient resolution different, and why does it change on method transfer?
The N–α–k relationship is most straightforward for isocratic elution, where mobile-phase composition is constant.2–4,8 In gradient elution the composition changes while analytes migrate, so no single constant k describes retention throughout the run. In linear-solvent-strength theory the isocratic relationship carries over with an effective retention factor k* (the value of k when the band reaches the column midpoint), which is set by gradient time, flow rate, column volume and the analyte’s solvent-strength parameter S rather than by a fixed mobile-phase composition.4,12 Initial composition, gradient slope and time, flow rate, column dimensions, temperature and dwell (gradient-delay) volume therefore all influence gradient resolution.
This is also why two instruments running the same programmed gradient do not expose the column to the same gradient at the same time. Dwell volume, the system volume between the point at which the gradient is formed and the column inlet, differs between systems and shifts when the gradient reaches the column, changing retention and peak spacing on transfer.13,14 Mixer and tubing volume, extra-column dispersion, injection configuration and column temperature contribute as well. If retention has moved along with resolution, start with the retention-time drift guide; for gradient design in a new method, see how to develop an HPLC method.
How do you verify that resolution has actually improved?
- Confirm the identities, retention and elution order of the critical peaks; selectivity changes can reorder them.
- Recalculate Rs with the same width convention as before, and inspect peak shape.
- Run replicate injections and challenge the relevant method variables.
- Check that the change has not created a new critical pair elsewhere in the chromatogram.
- Compare against the applicable acceptance criterion; for validated or compendial methods the procedure takes precedence over rules of thumb.5
Frequently asked questions
Is Rs = 1.5 always required?
No. Rs ≈ 1.5 corresponds to baseline separation for an ideal symmetric pair, but it is not a universal acceptance criterion. Many practitioners target Rs ≥ 2 for a safety margin, and the applicable procedure sets the actual requirement.5,6
What are the three main factors controlling HPLC resolution?
In the approximate fundamental relationship they are efficiency (N), separation factor (α) and retention factor (k), contributing as √N, (α − 1)/α and k/(1 + k) respectively.3,4,8
What is the most effective way to improve HPLC resolution?
It depends on what is limiting the critical pair. When two sharp peaks have α close to 1, changing separation factor gives substantially more leverage than more retention or efficiency. If the peaks are broad or poorly shaped, efficiency or peak-shape problems must be corrected first.3,4,8
What is the difference between selectivity and resolution?
Resolution describes the observed separation of two peaks relative to their widths. The separation factor α = k2/k1 describes their relative retention only. IUPAC formally uses “separation factor”; “selectivity” remains common but is discouraged as the formal name.2,9
What is the retention factor in HPLC?
The retention factor describes how long an analyte is retained relative to the hold-up time: k = (tR − tM)/tM. Older texts call it the capacity factor or capacity ratio, k′.10
Does increasing retention always improve resolution?
No. The retention contribution behaves as k/(1 + k), so increasing k gives diminishing returns once k is large: going from 10 to 20 raises the term only from 0.91 to 0.95.3,4,8
Does increasing column length improve resolution?
It can, by increasing plate number, but resolution depends on the square root of N. Doubling column length gives roughly a 41% gain in the efficiency term at the cost of double the run time and backpressure at the same flow rate.3,4,8
Why did my HPLC resolution change after method transfer?
For gradient methods, differences in dwell volume, extra-column volume, mixing behavior, temperature and gradient delivery between systems alter retention and peak spacing.13,14
The takeaway
HPLC resolution is not controlled by a single variable. The observed separation of two peaks reflects efficiency (N), separation factor (α), retention (k), peak shape and the performance of the chromatographic system. Figure 1 shows what an Rs value looks like; Figure 2 shows how each term can change it. The most useful optimization question is: what is limiting the resolution of this critical pair, and which single experiment will distinguish that mechanism from the alternatives?
References
- IUPAC, Compendium of Chemical Terminology (the “Gold Book”): peak resolution, Rs, in chromatography. DOI: 10.1351/goldbook.P04465.
- L. S. Ettre, “Nomenclature for chromatography (IUPAC Recommendations 1993)”, Pure and Applied Chemistry 65(4), 819–872 (1993).
- J. H. Purnell, “The correlation of separating power and efficiency of gas-chromatographic columns”, Journal of the Chemical Society, 1268–1274 (1960).
- L. R. Snyder, J. J. Kirkland and J. W. Dolan, Introduction to Modern Liquid Chromatography, 3rd ed., Wiley (2010).
- United States Pharmacopeia, General Chapter ⟨621⟩ Chromatography, USP–NF. DOI: 10.31003/USPNF_M99380_01_01.
- J. W. Dolan, “Testing Method Performance”, LCGC North America 27(2) (2009).
- J. W. Dolan, “Column Plate Number and System Suitability”, LCGC North America 34(3) (2016).
- V. Samanidou, “Basic LC Method Development and Optimization”, in Analytical Separation Science, Wiley-VCH (2015).
- IUPAC, Compendium of Chemical Terminology: separation factor, α, in column chromatography. DOI: 10.1351/goldbook.S05614.
- IUPAC, Compendium of Chemical Terminology: retention factor, k, in column chromatography. DOI: 10.1351/goldbook.R05359.
- D. Song and J. Wang, “Modified resolution factor for asymmetrical peaks in chromatographic separation”, Journal of Pharmaceutical and Biomedical Analysis 32(6), 1105–1112 (2003).
- L. R. Snyder and J. W. Dolan, High-Performance Gradient Elution: The Practical Application of the Linear-Solvent-Strength Model, Wiley (2007). DOI: 10.1002/0470055529.
- D. Guillarme, D. T.-T. Nguyen, S. Rudaz and J.-L. Veuthey, “Method transfer for fast liquid chromatography in pharmaceutical analysis: Application to short columns packed with small particle. Part II: Gradient experiments”, European Journal of Pharmaceutics and Biopharmaceutics 68(2), 430–440 (2008).
- Waters Corporation, “Measuring dwell volume”, Waters Help Center topic LCI-USG-0110 (updated 12 May 2026).
Further reading
- U. D. Neue, HPLC Columns: Theory, Technology, and Practice, Wiley-VCH (1997). The standard treatment of column efficiency, band broadening and extra-column effects.
- L. R. Snyder, J. J. Kirkland and J. W. Dolan, Introduction to Modern Liquid Chromatography, 3rd ed., Wiley (2010) — ref. 4; chapters 2 and 9 for the resolution relationship and gradient elution.
- L. S. Ettre, “Nomenclature for chromatography (IUPAC Recommendations 1993)” — ref. 2; the authoritative definitions of Rs, k, α and N.
Reviewed against primary sources. Every equation, definition and threshold on this page is checked against IUPAC terminology, USP ⟨621⟩ and the primary literature cited above. Numerical examples are illustrative calculations from the equations stated and are not method-development predictions or system-suitability acceptance criteria. Evidence review: September 2026.