
Drifting HPLC retention times are diagnosed by their pattern. Because tR = tM(1 + k), a shift that moves every peak by the same proportion means the hold-up time or the flow has changed, while a shift confined to some peaks means their retention factors have changed: chemistry, not flow or volume. Gradual, step, erratic, selective and converging movement each point to a different cause family.1,2
See also: equilibration, operating limits and storage practice that keep retention stable are covered in column care and maintenance for HPLC.
What does the pattern of retention time drift tell you?
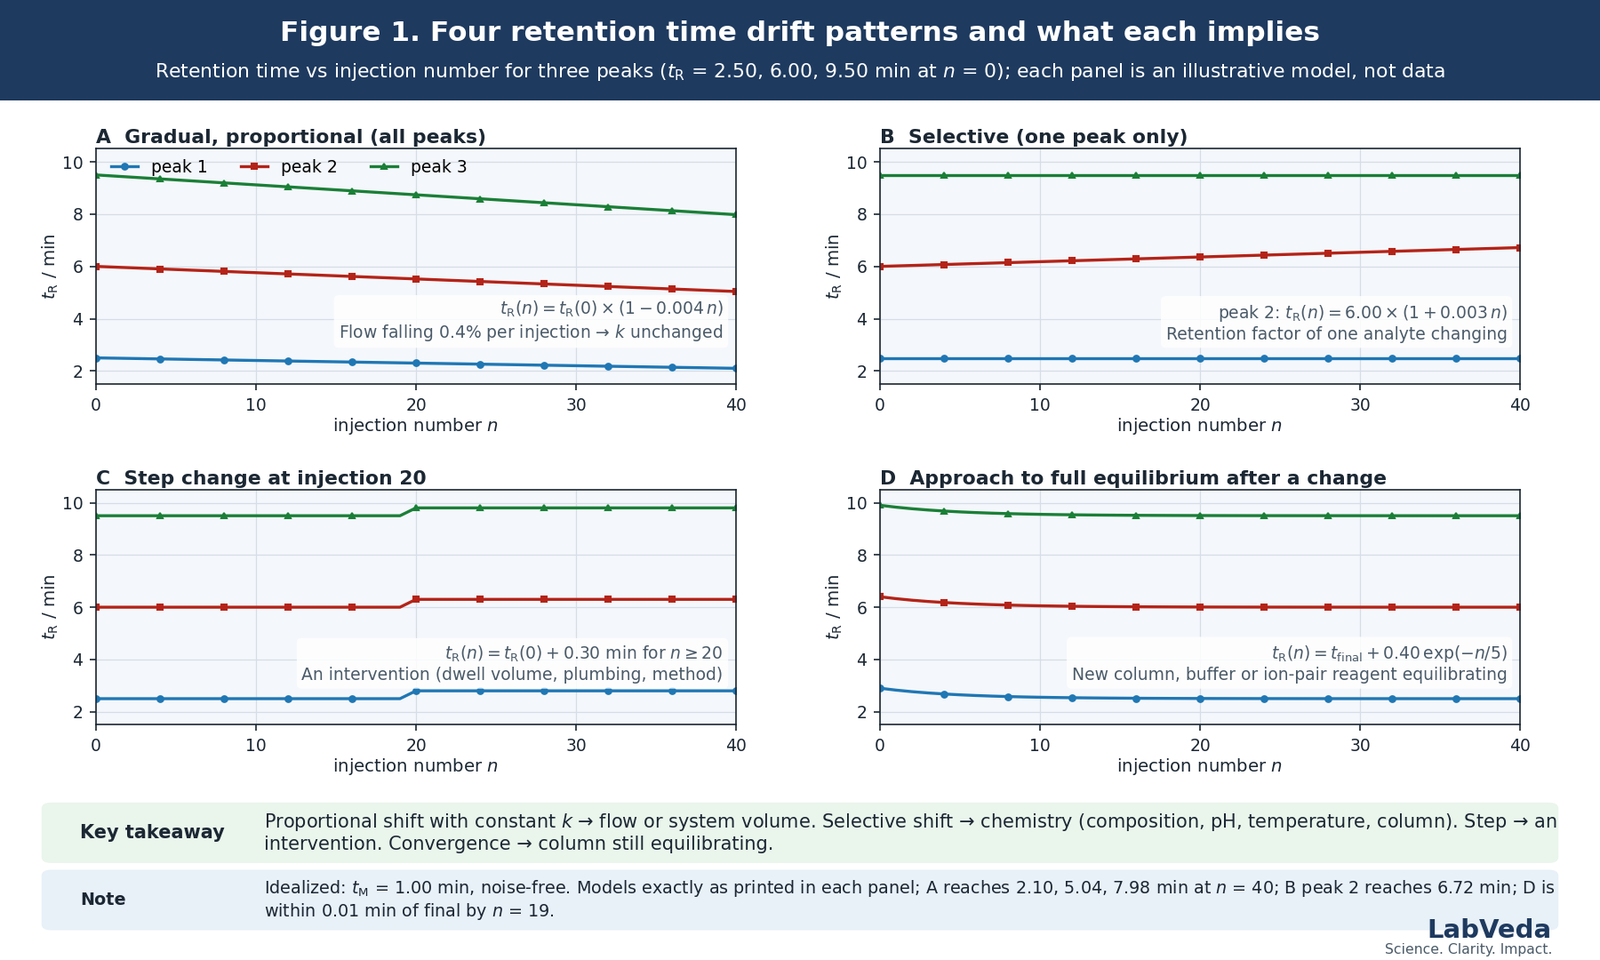
Plot retention time against injection number for an early and a late peak. Figure 1 shows four of the shapes from stated models (random scatter has no trend to plot); Table 1 maps every pattern to cause families and first checks.
The physics is the retention equation, with tM measured as the column void volume guide describes:2
tR = tM(1 + k)
Here k is the retention factor (capacity factor k′ in older texts), the ratio of adjusted retention time to hold-up time.1 Its calculation is covered in the HPLC retention factor guide. Flow enters only through tM; composition, temperature and pH act on k with an analyte-specific sensitivity. In isocratic runs, therefore, k per peak before and after the shift is the first discriminator: constant k means flow or volume, changed k means chemistry.3 In gradient elution the effective retention factor itself depends on flow and gradient volume, so compare gradient runs by the shift of tM and of the spacing between peaks instead.4
| Observed pattern | Higher-probability cause families | First discriminating checks |
|---|---|---|
| Gradual increase, all peaks | Flow falling; organic evaporating; temperature falling; slow equilibration | Pressure trend; k; fresh mobile phase; thermostat |
| Gradual decrease, all peaks | Flow increasing; stronger eluent; temperature increasing; bonded-phase loss | Actual flow and composition; thermostat; second column |
| Random, injection to injection | Bubbles; check-valve or seal faults; leaks; proportioning instability | Pressure ripple; purge; leak check |
| Step after an intervention | Wrong method, solvent or column; changed flow, gradient, dwell volume or temperature | Audit every change since the last good run |
| Only some peaks move | pH, ionic strength or additive; phase chemistry or lot; diluent or matrix | Buffer and pH; standard against sample; column lot |
| Early runs drift, then stable | Insufficient or inconsistent equilibration | Equilibrate to convergence, then fix the hold |
Chromatography Troubleshooting Decision Engine
Any HPLC symptom, one starting point — the engine narrows hundreds of failure modes to the few that fit your evidence.
How much do mobile phase composition and pH shift retention?
In reversed-phase HPLC the retention factor falls approximately log-linearly with the volume fraction of organic solvent φ, the linear-solvent-strength relation:4,5
log k ≈ log kw − Sφ
where kw is the extrapolated retention factor in water and S the solvent sensitivity, about 4–5 for small molecules; the ‘rule of 2.5’ (Snyder) or ‘rule of three’ (Dolan), a 10% change in %B changing k about 2.5–3-fold, corresponds to S = log 2.5/0.10 = 4.0 to log 3/0.10 = 4.8.6,7 With S = 4, a 1% absolute error in %B (Δφ = 0.01) gives Δlog k = 0.04, so k changes by 100.04 = 1.096, or 9.6%: a peak with k = 5.0 and tM = 1.00 min moves from 6.00 min to 1.00 × (1 + 5.0/1.096) = 5.56 min for 1% too much organic. Organic evaporating from an open reservoir or stripped by prolonged helium sparging weakens a premixed eluent the same way, progressively.3
For ionizable analytes, retention follows the degree of ionization, which changes sigmoidally with pH around the pKa measured in the actual aqueous–organic mixture, not in water; a small pH error near the pKa moves those peaks and leaves neutral ones alone.8 As a working comparison, Dolan found that a 0.2 pH unit change shifted a set of weak acids and bases as much as a 10 °C temperature change,7 so drift confined to acids or bases implicates buffer preparation, age and electrode calibration.
How much do flow rate and column temperature move retention times?
A delivered flow 1% low moves a 6.00 min peak to 6.06 min and a 2.50 min peak to 2.53 min, k unchanged. Pumps are specified to about ±1% flow accuracy, a bias that shifts every run alike, and to about ±0.07% RSD (≈ ±0.02 min) flow precision, so run-to-run scatter of ±0.02–0.05 min is normal and a monotonic trend is not.7 Leaks, worn seals, a sticking check valve or dissolved gas pull flow from the set point and usually show in the pressure trace, so log pressure against injection number too and read it with the HPLC backpressure diagnostic guide.
Temperature acts on k through the van ‘t Hoff relation, ln k = −ΔH°/(RT) + ΔS°/R + ln β (β the phase ratio), so ln k is close to linear in 1/T.9 As a working rule for small molecules, retention falls by about 2% per 1 °C rise, with 1–2% per °C the usual quoted range.3,7 For the k = 5.0 peak, 1 °C lowers k to 4.9 and tR from 6.00 to 5.90 min, so a 5 °C swing in an unthermostatted laboratory explains a half-minute drift. Since ΔH° is analyte-specific, temperature also changes selectivity.9
How much equilibration and gradient re-equilibration does retention time stability need?
Schellinger, Stoll and Carr showed the practical rule for gradient methods: retention repeatable to ±0.002 min was reached with at most two column volumes of initial eluent, while full equilibration of the stationary phase could require considerably more than 20 column volumes; in buffered eluents with basic analytes, two column volumes gave repeatability no worse than 0.004 min.10,11 Repeatable retention needs the same, adequate re-equilibration in every run, not complete re-equilibration: fix the post-gradient hold at one value and do not let the autosampler cycle time set it. Figure 1D is the different case of a column still approaching full equilibrium after a change of column, buffer or ion-pair reagent, or of a hold that varies between runs.
Dwell volume VD, from mixing point to column inlet, delays the gradient’s arrival by the dwell time12
tD = VD/F
so a method moved between systems of 1.0 and 3.0 mL dwell volume shifts gradient-eluted peaks by about 2.0 min at F = 1.0 mL/min and 4.0 min at 0.5 mL/min; early peaks that migrate during the delay move less, so relative retention changes too.4,12
Isocratic methods have their own slow equilibrations: ion-pairing reagents may need 20–50 column volumes or more, and retention of ionized solutes on some silica columns drifts for hours after a buffer change.13 In normal-phase chromatography the mobile phase water content controls the adsorbent’s activity and equilibrates slowly, so a defined, constant water content, often a half-saturated solvent, is the standard control.6
When is the column or the sample causing the retention time shift?
Column chemistry changes slowly and usually selectively. As a working rule, below about pH 2–3 the siloxane bond holding an alkyl ligand hydrolyzes and retention of hydrophobic analytes falls;6,14 silica dissolution accelerates above about pH 7–8, sooner with phosphate or carbonate buffers at higher temperature and concentration, and ends in a void.15 Strongly retained sample components accumulating at the inlet alter the surface, so in practice that drift tracks the number of samples, not time; a guard column absorbs it.3 A column that has lost retention and gained tailing at once belongs on the HPLC peak tailing diagnostic path.
A check standard injected at fixed intervals separates system drift, which moves the standards, from sample-dependent drift, which does not. Mass overload on a reversed-phase column, where the isotherm is Langmuir-shaped, moves the apex earlier with a sharp front and a tailing rear; a fronting peak that moves later is the signature of an anti-Langmuir isotherm or of a diluent much stronger than the mobile phase, shapes covered in the HPLC poor peak shapes guide. Both vanish when the injected amount or volume is reduced.6 Table 2 adds the cross-evidence.
| Additional evidence | Interpretation | Next check |
|---|---|---|
| Pressure drifts with retention | Restriction, viscosity or composition change, bubbles, pump instability | Overlay pressure and tR by injection; purge; leak test |
| Pressure stable; all peaks drift; k constant | Delivered flow or system volume | Measure flow or tM; audit plumbing and dwell volume |
| Pressure stable; all peaks drift; k changes | Composition, temperature or equilibration | Fresh mobile phase; column temperature; re-equilibration test |
| Standards stable, samples unstable | Diluent, matrix, overload, carryover | Compare blank, standard and sample; reduce load; match diluent |
What is the six-step sequence for diagnosing HPLC retention time drift?
- Confirm the pattern against Figure 1 and Table 1; in isocratic runs compute k per peak before and after.
- Audit the method and every recent change: column lot, flow, gradient, temperature, solvents, additives and plumbing.
- Check the mobile phase: prepare it fresh by the method’s procedure and verify composition, pH and additive.
- Verify delivery and temperature: pressure trace, leak check, purge, measured flow, actual column temperature.
- Test equilibration: double the initial and between-run equilibration; if retention converges, fix the longer value.
- Separate system from column and sample: run a check standard; if it is stable while samples drift, work on diluent, load and cleanup; if it drifts too, compare with a second column.
Frequently asked questions
Why are my HPLC retention times decreasing over a sequence?
Every peak decreasing by the same proportion, with k unchanged, means delivered flow is increasing or the system volume has shrunk: check the set point, the plumbing and the measured flow. Every peak decreasing with k also falling means a stronger eluent, a warmer column or a column losing bonded phase; only some peaks decreasing points to pH, additive or low-pH hydrolysis. Compare a second column of the same lot before blaming the column.
Why are my HPLC retention times increasing?
Start with delivered flow and column temperature, the two causes that move every peak: a leak, a worn seal, a sticking check valve or a bubble lowers flow, and a laboratory cooling overnight raises every retention time. A weakening mobile phase from selective evaporation is real but, in Dolan’s experience, fairly rare; it is still the cheapest check, so replace it with a fresh, separately measured batch before opening the pump. An increase confined to acids or bases points to the buffer.
How long should the column equilibrate before injecting?
There is no universal number, so measure it. Inject a standard repeatedly from the moment the mobile phase reaches the column and plot retention against injection number; the column is equilibrated when successive values agree within the method’s own precision. Record that time, or the equivalent column volumes, in the method file, use it at every installation and repeat the measurement when the lot, buffer or additive changes.
Why do retention times shift between two HPLC systems running the same gradient?
The instruments almost certainly differ in dwell volume. Measure both: replace the column with a capillary, run the programmed gradient from water to water containing a UV-absorbing tracer and read the delay between the programmed and the observed rise. Then add an initial hold equal to the difference on the smaller-dwell system, or delay the injection where the instrument allows it, and confirm that the early peaks, the ones the dwell difference reorders, regain their relative retention.
Is a change in retention time an acceptable system-suitability result?
Only the method decides. USP General Chapter ⟨621⟩ makes system suitability the method’s own acceptance test and permits defined adjustments to conditions such as column temperature and flow rate, but sets no universal retention-time tolerance; a validated or compendial method’s criteria take precedence over any rule of thumb.16 A drift plot adds the ability to see a trend while values are still inside the window, when the cause is cheapest to find.
The takeaway
Retention time drift is a pattern before it is a component. Plot tR against injection number and sort the problem into flow and volume, which move everything proportionally, or composition, temperature, pH, equilibration and column chemistry, which move retention factors and usually move peaks selectively. A 1% composition error shifts k by nearly 10%, a 1 °C change by about 2% and a 1% flow error every retention time by 1%, so the cheap checks come first, and the column is replaced only after standards and samples have been compared and the drift has survived all of them.
References
- IUPAC, “retention factor, k (in column chromatography)”, Compendium of Chemical Terminology (the “Gold Book”), online version, DOI 10.1351/goldbook.R05359; from L. S. Ettre, Pure Appl. Chem. 65, 819 (1993).
- L. S. Ettre, “Nomenclature for chromatography (IUPAC Recommendations 1993)”, Pure Appl. Chem. 65(4), 819–872 (1993).
- J. W. Dolan, “Troubleshooting Basics, Part III: Retention Problems”, LCGC North Am. 29(12) (2011).
- L. R. Snyder and J. W. Dolan, High-Performance Gradient Elution: The Practical Application of the Linear-Solvent-Strength Model, Wiley (2007).
- L. R. Snyder, J. W. Dolan and J. R. Gant, “Gradient elution in high-performance liquid chromatography. I. Theoretical basis for reversed-phase systems”, J. Chromatogr. 165(1), 3–30 (1979).
- L. R. Snyder, J. J. Kirkland and J. W. Dolan, Introduction to Modern Liquid Chromatography, 3rd ed., Wiley (2010).
- J. W. Dolan, “How Much Retention Time Variation is Normal?”, LCGC Europe 27(8) (2014).
- E. Bosch, P. Bou, H. Allemann and M. Rosés, “Retention of Ionizable Compounds on HPLC. pH Scale in Methanol–Water and the pK and pH Values of Buffers”, Anal. Chem. 68(20), 3651–3657 (1996).
- J. W. Dolan, “Temperature selectivity in reversed-phase high performance liquid chromatography”, J. Chromatogr. A 965(1–2), 195–205 (2002).
- A. P. Schellinger, D. R. Stoll and P. W. Carr, “High speed gradient elution reversed-phase liquid chromatography”, J. Chromatogr. A 1064(2), 143–156 (2005).
- A. P. Schellinger, D. R. Stoll and P. W. Carr, “High-speed gradient elution reversed-phase liquid chromatography of bases in buffered eluents. Part I. Retention repeatability and column re-equilibration”, J. Chromatogr. A 1192(1), 41–53 (2008).
- J. W. Dolan, “Gradient Elution, Part IV: Dwell-Volume Problems”, LCGC North Am. 31(6) (2013).
- J. W. Dolan, “Slow Column Equilibration”, LCGC North Am. 33(2) (2015).
- J. J. Kirkland, J. L. Glajch and R. D. Farlee, “Synthesis and characterization of highly stable bonded phases for high-performance liquid chromatography column packings”, Anal. Chem. 61(1), 2–11 (1989).
- J. J. Kirkland, M. A. van Straten and H. A. Claessens, “High pH mobile phase effects on silica-based reversed-phase high-performance liquid chromatographic columns”, J. Chromatogr. A 691(1–2), 3–19 (1995).
- United States Pharmacopeia, General Chapter ⟨621⟩ Chromatography, USP–NF, DOI 10.31003/USPNF_M99380_01_01.
Further reading
- L. R. Snyder, J. J. Kirkland and J. W. Dolan, Introduction to Modern Liquid Chromatography, 3rd ed., Wiley (2010) — ref. 6.
- L. R. Snyder and J. W. Dolan, High-Performance Gradient Elution: The Practical Application of the Linear-Solvent-Strength Model, Wiley (2007) — ref. 4.
- J. W. Dolan and L. R. Snyder, Troubleshooting LC Systems: A Comprehensive Approach to Troubleshooting LC Equipment and Separations, Humana Press (1989).
Reviewed against primary sources. Every equation, definition and threshold on this page is checked against the IUPAC Gold Book and the 1993 IUPAC recommendations on chromatographic nomenclature and against the primary literature cited above; USP General Chapter ⟨621⟩ is cited for the precedence of compendial system-suitability criteria. Numerical examples are illustrative calculations from the equations stated and are not method-development predictions or acceptance criteria. For validated or compendial methods, the applicable procedure and regulatory framework take precedence over the general rules of thumb given here. Evidence review: September 2026.