
The Knowledge Hub
Practical troubleshooting guides for working analytical chemists — HPLC, UHPLC, LC-MS, GC, and reagent prep. Each guide is diagnostic-first and linked to the tool that resolves it.
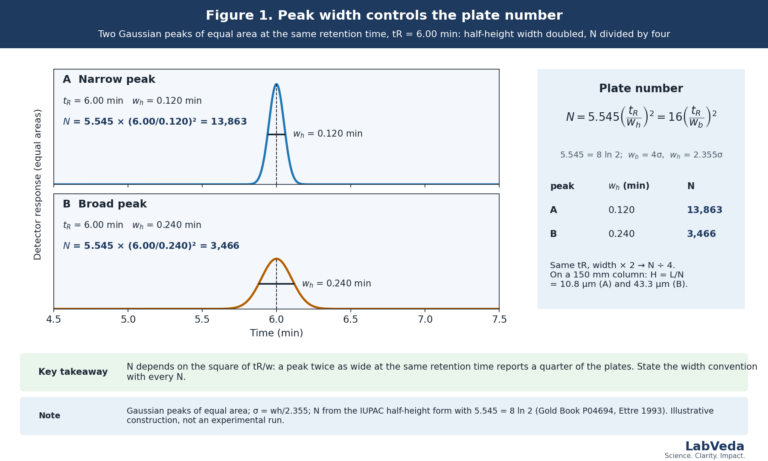
HPLC Theoretical Plates (N) and HETP: Formula, Calculation and Efficiency
How to calculate HPLC theoretical plates (N) and plate height (HETP), what the numbers mean, and whether low efficiency is the column,…
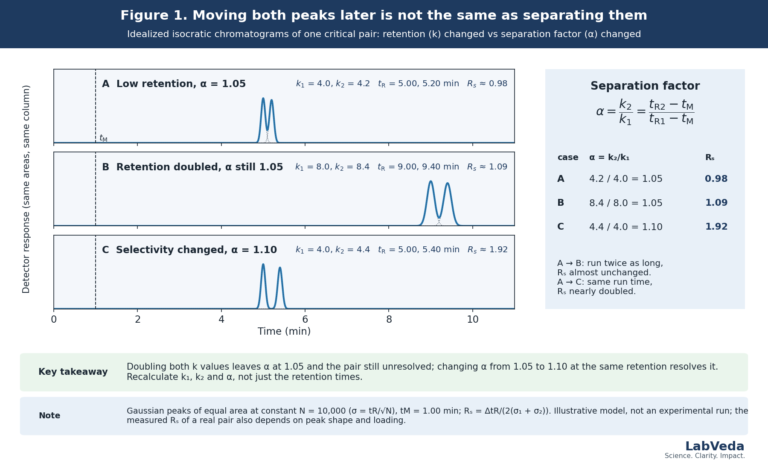
HPLC Separation Factor (α): Formula, Selectivity and How to Change It
How to calculate the HPLC separation factor α from retention factors, why it has the most leverage on resolution, and which variables…
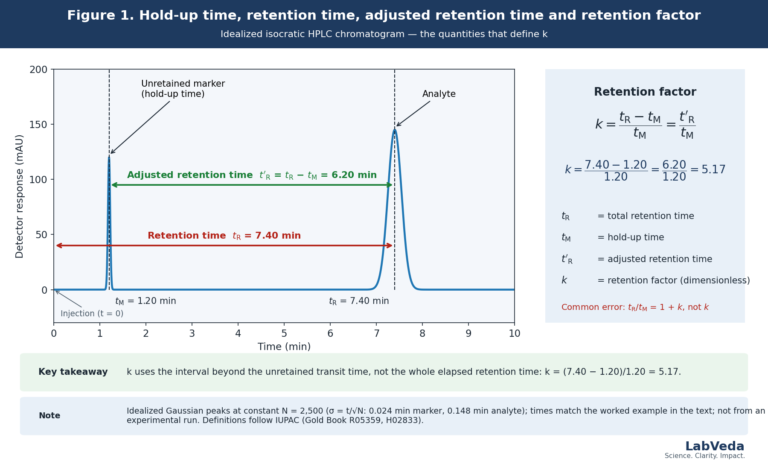
HPLC Retention Factor (k): Formula, Calculation and What the Value Means
How to calculate the HPLC retention factor k from retention time and hold-up time, what k values mean, why k′ is legacy…
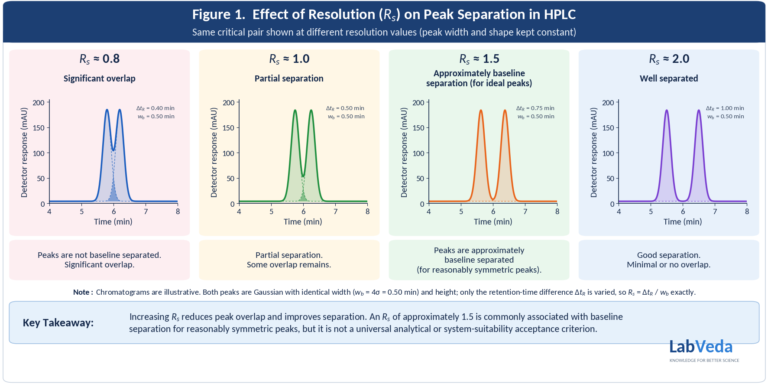
HPLC Resolution (Rs): Formula, Meaning and How to Improve It
HPLC resolution (Rs) explained: formula, worked example, what Rs = 1.5 means, and how efficiency (N), separation factor (α) and retention (k)…
Ion Suppression and Matrix Effects in LC-MS
Ion suppression is a loss of analyte signal caused by co-eluting matrix components competing for charge during electrospray ionisation. It is the…
LC-MS Sensitivity Loss: A Six-Step Diagnostic Checklist
Diagnosing LC-MS sensitivity loss means answering one question first: are analyte molecules failing to reach the source, failing to ionise once there,…
Autosampler Carryover in HPLC and LC-MS: How to Find It and Wash It Out
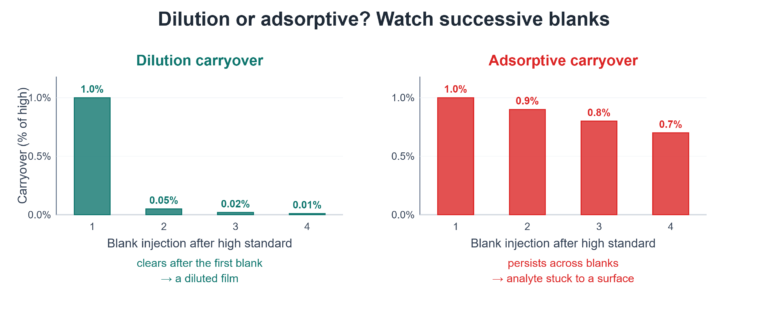
Figure 1. Carryover across successive blank injections. Dilution carryover falls to near zero after the first blank; adsorptive carryover decays slowly and…
HPLC Baseline Noise and Drift: How to Tell Them Apart and Fix Each
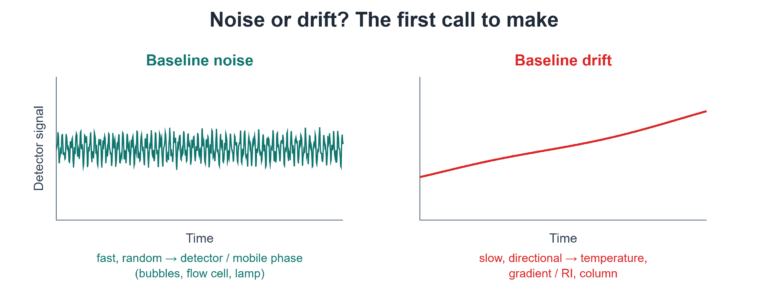
Figure 1. Noise versus drift. Fast random jitter points to the detector or mobile phase; a slow directional shift points to temperature,…
Ghost Peaks in HPLC: What Causes Them and How to Eliminate Them
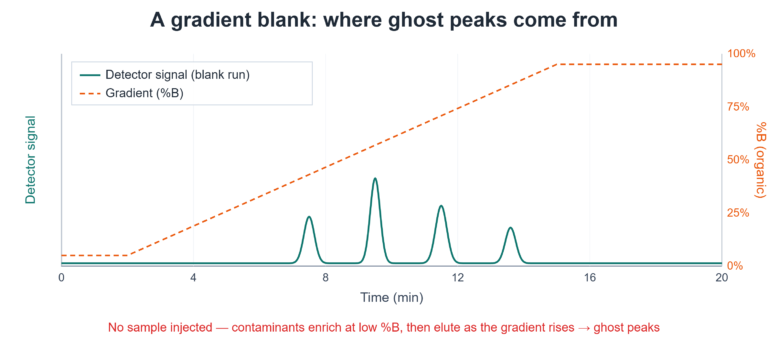
Figure 1. Ghost peaks in a gradient blank. Sharp peaks elute as %B rises even though nothing was injected — contaminant concentrated…
Why Your HPLC Peaks Are Tailing: Causes and a Diagnostic Path
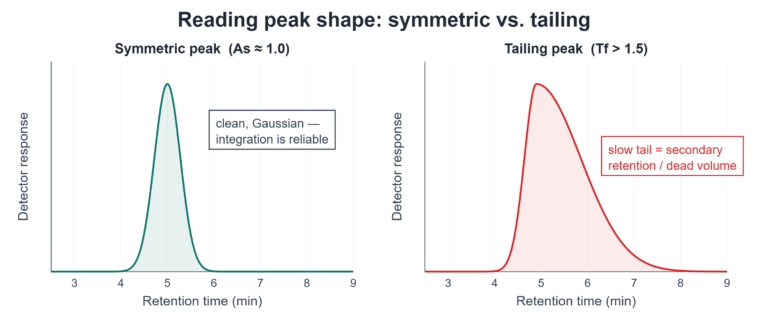
Figure 1. Symmetric versus tailing peak. A symmetric peak sits near As 1.0; the tailing peak shows the slow trailing edge produced…
High Backpressure in HPLC: 8 Root Causes and How to Diagnose Each One
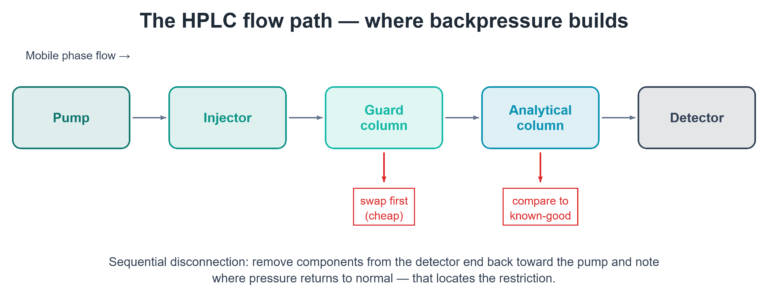
Figure 1. The HPLC flow path. Disconnecting components in sequence from the detector back towards the pump localises the restriction. High system…
Understanding Size Exclusion Chromatography Techniques
If you’re delving into the world of chromatography, you might have come across a technique called size exclusion chromatography (SEC). This method…