
Gas chromatography troubleshooting is the discipline of working from the symptom pattern of a failing chromatogram, not from a suspected part, to the one subsystem (sample, inlet, pneumatics, column and oven, detector or data system) that explains every symptom with the fewest assumptions, and confirming it with a known standard before anything is replaced.
Most GC faults leave a signature that a comparison with a reference run can read. Figure 1 shows the two most useful discriminators, Table 1 sorts problems by what changed, Table 2 maps each symptom to its cause families and first checks, and a six-step sequence with the cross-evidence rules of Table 3 constrains the diagnosis.
How do you start GC troubleshooting: what changed?
Establish the time course of the failure and whether it follows the sample or the system before opening the inlet; Table 1 gives the triage. A sudden fault after maintenance is almost always something that was touched; a gradual one is more compatible with contamination, trap exhaustion, inlet activity, detector fouling or phase aging;1,2 one seen only for samples and not for a clean standard belongs to sample preparation or matrix.
| Pattern | More likely cause families | First evidence to collect |
|---|---|---|
| Sudden, after maintenance or a column change | Installation (insertion depth, cut, ferrule leak); septum or liner change; method reloaded with wrong column dimensions or gas; detector reassembly | Maintenance log; leak check at the fittings opened; method against the last good run |
| Sudden, no maintenance | Cylinder or generator change; regulator failure; septum coring; syringe failure; power or data-system event | Supply-pressure trend; inlet pressure and flow trace; injection log |
| Gradual, over many injections | Inlet contamination and activity; liner and septum wear; detector fouling; trap exhaustion; phase loss at the column inlet | Overlay the standard at intervals; trend active-probe tailing, bleed and a reference area |
| Standard normal, samples abnormal | Sample preparation, diluent, matrix, stability, concentration and overload | Re-inject the standard between samples; dilute a sample; run a matrix blank |
| Erratic, run to run | Pneumatic instability; intermittent leak; inadequate equilibration; injection timing | Trend inlet pressure and one early retention time across the sequence |
Chromatography Troubleshooting Decision Engine
Any HPLC symptom, one starting point — the engine narrows hundreds of failure modes to the few that fit your evidence.
Which GC symptom points to which cause: the troubleshooting matrix
Table 2 is the symptom-first matrix: its cause families are hypotheses to discriminate between, not diagnoses, and the first checks are ordered cheapest first. The sections that follow give the physics behind each discriminator.
| Symptom | Higher-probability cause families | First checks |
|---|---|---|
| No peaks | Injection failure; no carrier flow; column broken, disconnected or plugged; detector off or unlit; wrong acquisition channel | Injection event, carrier flow, detector status, column continuity, data channel |
| Low sensitivity | Leak; split ratio or splitless purge time wrong; inlet discrimination; detector contamination or gas settings; adsorption in a dirty liner | Known standard; leak-check; split flow, purge time, detector gases; liner and seal |
| Retention shift, all peaks | Later: column flow falling (leak, supply, regulator, restriction) or oven cold. Earlier: flow above set point, oven hot, column trimmed without updating the method | Actual pressure and flow against the method; leak-check; oven calibration; column entry in the method |
| Retention shifts, some peaks only | Stationary-phase loss or contamination at the inlet end; matrix interaction; co-elution | Compare k and separation factors, not raw times; standard in clean solvent |
| Tailing | Active sites in liner, seal or column inlet; dead volume at a connection; overload of specific analytes | Active-probe standard; liner, seal, column cut and insertion depth; reduce load |
| Fronting | Column or inlet overload; splitless solvent that does not wet the phase (flooded zone); initial temperature too high for solvent trapping | Dilute or raise the split ratio; match solvent to phase or fit a retention gap; lower the initial temperature only for the trapping failure |
| Broad peaks | Linear velocity far from optimum; dead volume; poor installation; phase damage; constant-pressure mode late in a program | Verify linear velocity and installation; inspect column ends |
| High or noisy baseline | Contaminated gases or exhausted traps; column bleed; detector contamination; leaks admitting air; electrical noise | Blank program; temperature dependence; traps, gas purity, detector, grounding |
| Ghost peaks | Carryover; septum or liner bleed; carrier contaminants trapped at the column head; retained matrix; solvent | Blanks: no injection → solvent → standard; replace septum and liner; bake out |
Why do GC retention times shift, and why do all peaks move together?
Under isothermal conditions every retention time is the hold-up time multiplied by one plus the retention factor:
tR = tM(1 + k)
where tM is the hold-up time (historically the dead time) and k = (tR − tM)/tM the retention factor (capacity factor k′ in older texts), following the IUPAC definition of total retention time.3,4 The hold-up time is the column length divided by the average linear velocity, tM = L/ū, and is measured with an unretained marker: methane on a flame ionization detector, air or methane on a thermal conductivity detector; the discriminator below depends on having that value in both the reference and the failing run.5,6 For a given column k = K/β depends on the phase and its phase ratio β (fixed by film thickness and internal diameter), the analyte and the temperature, not on the flow.5 A change in carrier flow therefore changes tM and leaves k untouched, so every retention time scales by the same factor. That is the first discriminator in Figure 1: with the flow reduced by 10%, tM rises from 1.00 to 1/0.90 = 1.111 min and peaks at 3.00, 5.00 and 8.00 min move to 3.33, 5.56 and 8.89 min. Peaks that move by different factors point instead to the phase, the sample or a co-elution.
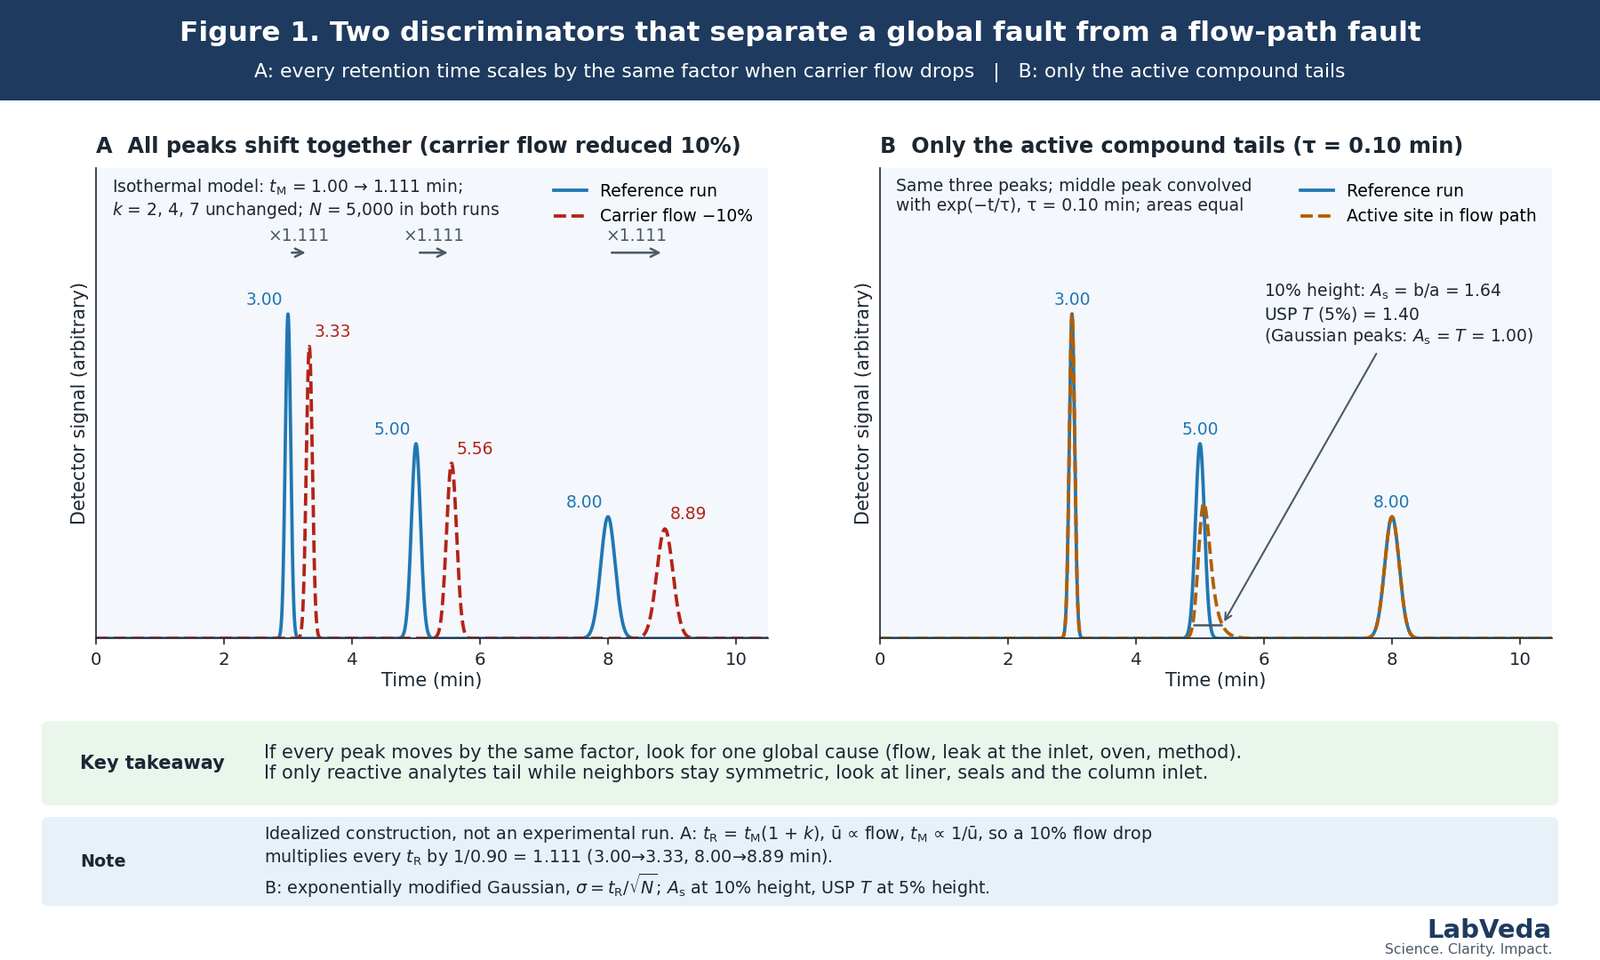
Three physical facts explain most global shifts. How a leak shows depends on the pneumatics: with a mechanical regulator, a leak between regulator and column lowers the head pressure the column sees, so column flow falls and every peak moves later; with electronic pneumatic control (EPC) the sensor sits at the inlet and a septum, seal or ferrule leak is a parallel path downstream of it, so the set pressure is held, the measured total flow rises, and retention moves only when the supply or the controller can no longer keep up.1 Gas viscosity increases with temperature, so under constant-pressure control the flow falls as the oven climbs, and a method moved between constant-pressure and constant-flow modes shifts late peaks more than early ones.9 And retention factors fall roughly exponentially with temperature (ln k close to linear in 1/T), so an oven a few degrees off moves retention while leaving tM essentially unchanged (exactly so in constant-flow mode).2 If tM moved by the same factor as the peaks, the cause is flow; if it is unchanged and k moved, it is temperature or the phase.
What carrier-gas velocity should a GC column run at?
Peak width, unlike retention, depends on linear velocity through the plate height H, whose dependence on ū was first described by van Deemter for packed columns.10 For an open-tubular column Golay derived the corresponding equation, which has no eddy-dispersion term:
H = B/ū + (CM + CS) ū
where H is the plate height, B the longitudinal-diffusion coefficient and CM and CS the mobile- and stationary-phase mass-transfer terms.11,12 H is minimal at ūopt = √(B/(CM + CS)); because B ∝ DM and CM ∝ 1/DM, the optimum scales with the diffusion coefficient of the analyte in the carrier gas and is highest for hydrogen, then helium, then nitrogen. Hinshaw’s worked Golay-plot example gives efficient ranges of 18–45 cm/s for helium, 25–65 cm/s for hydrogen and 8–20 cm/s for nitrogen, with optima near 30 cm/s (helium) and 40 cm/s (hydrogen) and hydrogen losing efficiency more slowly above its optimum.13 Columns with large pressure drops depart from the simple Golay picture, so let the manufacturer’s data and a measured plot of H against ū set the operating point.9 Hydrogen carrier is flammable: instrument manufacturers specify a hydrogen sensor or oven shut-off and a rated total-flow limit; follow that specification, and treat the leak check as a safety step.
What causes GC peak tailing, fronting and broad peaks?
Establish which analytes are affected. Tailing confined to polar or reactive analytes while hydrocarbons stay symmetric is secondary retention on active sites, usually silanols on a glass liner, a contaminated seal or the first coils of the column.1,2 Panel B of Figure 1 models that process: convolving a symmetric peak with an exponential of time constant τ = 0.10 min gives an exponentially modified Gaussian with As = 1.64 at 10% height, while its neighbors keep As = 1.00.7 Tailing of every peak, solvent included, is dead volume: a ragged column cut, a wrong insertion depth, an unswept union.1 The compendial convention is the USP ⟨621⟩ tailing factor T = W0.05/2f at 5% height, 1.0 for a Gaussian peak and 1.40 for the same tailed peak; where a method sets a system-suitability limit, that limit controls.8
Fronting is overload: the phase near the inlet is saturated, or a splitless injection has flooded the column with a solvent that does not wet the phase, so the band spreads before it is focused. Dilution or a higher split ratio removes the first; a solvent that wets the phase or an uncoated retention gap removes the second, whereas lowering the initial oven temperature is the fix for a different failure, an initial temperature too high for solvent trapping.14 Broad but symmetric peaks are an efficiency problem: a velocity far from the Golay optimum, a constant-pressure method whose late peaks elute well below it, dead volume, or a phase that has lost film.9,12 When shape loss is confined to the inlet end, trimming a short length and reconditioning is the cheapest corrective; the GC capillary column care guide gives the procedure and the limits.
What is inlet discrimination and how does it show up?
In a hot split or splitless injection the sample does not vaporize instantaneously: volatiles leave the needle and liner first, and a fraction of the high boilers stays behind in the needle, on a cold spot or in a liner too small for the vapor cloud. In splitless mode the same loss appears when the purge-activation time is too short to transfer the last analytes.14 The signature is a response loss that grows with boiling point across a homologous series in the standard, with shape and retention normal; a detector fault does not sort by boiling point, and a septum leak during injection, if anything, loses the volatiles first.
What causes GC baseline noise, drift and column bleed?
Separate the three by their time dependence in a blank run with no injection. Noise does not follow the oven program (detector gases, traps, a dirty jet or collector, an unstable flame, a loose connection); drift and bleed do. Column bleed is the loss of low-molecular-mass fragments from the stationary phase; their vapor pressure increases exponentially with temperature, so the baseline climbs during the ramp and levels off in the final hold, and on a mass spectrometer polydimethylsiloxane bleed is recognized by the cyclic-siloxane ions at m/z 207 and 281.15,16 Bleed is normal at a low level; what matters is a rise against the column’s specified bleed at its upper temperature limit.
Oxygen determines that history. Polysiloxane and especially polyethylene-glycol phases are oxidized at elevated temperature, and the oxygen enters through leaks, exhausted traps or a poor cylinder; time at temperature with air in the carrier permanently raises the bleed and strips phase from the inlet end, which then becomes the active site that makes polar analytes tail.2,15 Leak control and gas purification are therefore bleed prevention. On a flame ionization detector a contaminated jet or a wrong hydrogen-to-air ratio also gives a high or noisy baseline independent of oven temperature; the flame ionization detector guide covers gas settings and cleaning. The first question, whether a disturbance is periodic, random or monotonic, is the one the HPLC baseline noise and drift guide asks; only the fixes differ.
Why is GC sensitivity low, or why are there no peaks at all?
Inject a known standard first, because it splits the problem in two: if the standard is also low the fault is in the system (leak, split ratio or purge time not as the method says, discrimination, an adsorbing liner, detector gases or temperature, a column that has lost phase); if only the samples are low the fault is upstream, in preparation, diluent, stability or matrix. No peaks at all is a discontinuity, not a sensitivity problem: syringe, carrier flow, column continuity, detector ignition and data channel, checked in that order.1 A loss similar for every peak points to inlet or detector; a loss that grows with boiling point points to discrimination.
Where do ghost peaks in GC come from?
Ghost peaks appear where nothing was injected or do not belong to the sample. A recent review catalogs the origins (cross-contamination, sample decomposition, septum bleed, liner reactivity, column bleed, memory effects, solvent polarity, contaminated carrier, tubing, seals, vents and detector) and proposes double-blank, condensation and inlet-contamination tests to separate them.17 This page’s procedure groups them by subsystem: a run with no injection isolates carrier, septum, liner and column; a solvent injection adds syringe and solvent; a standard adds the sample path. Ghosts that grow with the length of the previous cool period are contaminants trapped at the column head and released on the next ramp; ghosts at a fixed retention time whatever was injected are carryover.15 Carryover is diagnosed as in liquid chromatography, by a blank after the highest standard; the autosampler carryover guide gives the test design, and in GC the usual culprits are syringe, septum and liner.
What causes GC pressure and flow instability?
Pressure or flow that wanders propagates into retention and area, so it is diagnosed first. Check the supply chain (cylinder pressure and its rate of fall, a creeping regulator, restrictive traps, the margin the inlet controller needs above its set point), then the inlet (cored septum, blocked septum purge, restricted split vent, any fitting opened at the last maintenance). With a mechanical regulator a leak appears as a head pressure that cannot be held with the vent closed and as later retention. With EPC, compare the measured total flow with the value the method predicts for the set split ratio: a leak shows as excess total flow, as a set pressure the controller cannot reach, or in a pressure-decay test with the split vent closed, which is the direct check.1,2 Leak-check with an electronic detector, never with a liquid on a hot inlet.
What is the disciplined GC troubleshooting sequence?
The sequence protects the evidence and prevents the multi-variable repair that destroys it; Table 3 gives the cross-evidence rules used at step 4.
- Preserve the evidence. Save the failing chromatogram, the method as run, pressure and flow traces, oven and detector actuals and the maintenance history before anything is changed.
- Reproduce with a known standard. Decide whether the failure is system-wide or sample-specific; overlay on the last good run of the same standard.
- Check the simple system conditions. Gas supply and traps, leaks at the fittings last opened, temperatures, actual against set pressure and flow, septum and liner age, detector state, installation.
- Localize the subsystem. Work in flow order: sample and inlet, pneumatics, column and oven, detector, data system, choosing the discriminating experiment from Table 2 and Table 3.
- Change one variable. Make a single corrective action and record it; two parts replaced at once lose the diagnosis even if the symptom disappears.
- Verify recovery. Re-inject the same standard and compare retention, area, shape, baseline and pressure against the benchmark, not against memory.
| Cross-evidence pattern | Interpretation | Discriminating action |
|---|---|---|
| All peaks shift by the same factor, tM included | Global flow, pressure or leak effect (Figure 1, A) | Actual pressure and flow against the method; leak-check the inlet; column dimensions in the method |
| Peaks shift, tM unchanged | Temperature or stationary-phase effect on k | Oven calibration and equilibration; separation factors against the reference run |
| Every peak tails, solvent included | Dead volume or a bad connection | Re-cut and re-install; check insertion depths and unions |
| Only active compounds tail, hydrocarbons symmetric | Flow-path activity: liner, seal, column inlet (Figure 1, B) | Active-probe mixture; replace liner and seal; trim the inlet |
| Response falls with boiling point, shape and retention normal | Inlet discrimination or incomplete splitless transfer | Liner volume, injection speed, purge time, inlet temperature |
| Baseline rises with the oven program, flat isothermally | Column bleed or temperature-dependent contamination | Compare with the column’s bleed at its upper limit; leak-check for oxygen |
| Baseline noisy at constant temperature | Detector, gases or electrical source | Detector gas purity and flows, jet cleanliness, grounding |
| Pressure unstable and retention unstable | Pneumatic, restriction or leak problem | Trend supply pressure; leak-check; replace septum and traps |
When should the GC column actually be replaced?
Not because the chromatography is poor. A column is replaced when a known standard remains abnormal after leaks, actual flow, temperatures, liner, septum, installation, detector and method configuration have been excluded; when trimming the inlet end and reconditioning does not restore shape or response; when bleed at the upper temperature limit stays far above its earlier value; or when physical damage is evident.1 The common error is replacing a column damaged by a leak without fixing the leak, because the new column follows the same path. Keep the old column labeled: if the new one shows the same symptom, the fault was never the column.
Frequently asked questions
Why are all my GC retention times shifting later?
When every peak, hold-up time included, moves later by the same factor, column flow has fallen (Figure 1, A). On a mechanically regulated inlet suspect a leak or supply deficit lowering head pressure; on an EPC inlet the pressure is held, so suspect a supply or trap restriction starving the controller, or a method reloaded with the wrong column dimensions or carrier gas, which makes the instrument calculate the wrong pressure for the flow it displays. Check the method’s column entry before touching hardware.
What is the difference between peak tailing and peak fronting in GC?
Tailing is a drawn-out trailing edge; fronting is a sloping leading edge. Tailing that sorts by chemistry is activity and tailing of every peak is a connection, whereas fronting is overload of the phase or a flooded splitless zone. The practical test is a dilution series of the standard: fronting shrinks as the mass injected falls, while activity-driven tailing gets worse at low mass because a fixed number of active sites retains a larger fraction of a smaller sample.1 A dead-volume tail is unchanged by dilution.
How do I tell column bleed from a contaminated detector?
Run the temperature program with no injection, then hold the oven at a low temperature for the same time. Bleed tracks the oven and disappears at low temperature; detector or gas contamination persists at any temperature and often shows as noise rather than a smooth rise. On a GC-MS bleed gives the siloxane ions, while a fouled source or contaminated gas gives ions unrelated to the phase. Compare the reading with the column’s specified bleed at its upper isothermal limit before condemning it, and find the oxygen source first.
What is the fastest GC leak check?
On an EPC inlet, run the instrument’s pressure-decay test with the split vent closed, or compare the measured total flow with the total the method predicts for the set split ratio; excess total flow or an unreachable set pressure means a leak. On a mechanically regulated inlet, close the vent and watch whether the head pressure holds. Then pass an electronic leak detector, never a liquid, around the septum nut, the column ferrules, the liner seal and any fitting opened at the last maintenance, and re-check after the first heating cycle, because a ferrule that seals cold can open as it heats.
Why does my GC show ghost peaks in a blank?
A ghost in a no-injection blank cannot come from the sample, so the suspects are carrier gas, septum, liner and column. The quickest split is two blanks with different inter-run cool periods: a ghost that grows with the wait is a trapped contaminant, and a ghost that is the same size either way is a septum or liner emission. Replace the septum and liner first, the cheapest and most frequent source, before extending the bake-out or changing gas traps.
Does hydrogen carrier gas change how I troubleshoot?
The logic is the same, but three things change. The optimum linear velocity is higher, near 40 cm/s against near 30 cm/s for helium in Hinshaw’s example, so a helium method moved to hydrogen at the same velocity runs below its optimum and gives broader peaks. Hydrogen is flammable: instrument manufacturers specify a hydrogen sensor or oven shut-off and a rated total-flow limit; follow that specification. And hydrogen is less than half as viscous as helium, so the same head pressure gives a higher flow and the pressure set point must be re-derived.
The takeaway
Retention time is tM(1 + k), so a flow problem moves every peak by the same factor and a temperature or phase problem moves k alone; tailing that sorts by chemistry is activity and tailing that touches every peak is a connection; bleed follows the oven and noise does not; a loss that grows with boiling point is discrimination. Preserve the failing evidence, reproduce with a known standard, check gas, leaks, temperatures and actual flow before any part is replaced, change one variable and verify against the benchmark. The column is the last suspect, replaced only once the leak that would damage its successor has been found.
References
- D. Rood, The Troubleshooting and Maintenance Guide for Gas Chromatographers, 4th ed., Wiley-VCH (2007), DOI 10.1002/9783527611300.
- R. L. Grob and E. F. Barry (eds.), Modern Practice of Gas Chromatography, 4th ed., Wiley (2004), DOI 10.1002/0471651141.
- IUPAC, “total retention volume, VR; total retention time, tR“, Compendium of Chemical Terminology (the “Gold Book”), online version, DOI 10.1351/goldbook.T06413; from L. S. Ettre, Pure Appl. Chem. 65, 819 (1993).
- IUPAC, “retention factor, k“, Compendium of Chemical Terminology (the “Gold Book”), online version, DOI 10.1351/goldbook.R05359; from L. S. Ettre, Pure Appl. Chem. 65, 819 (1993).
- L. S. Ettre, “Nomenclature for chromatography (IUPAC Recommendations 1993)”, Pure Appl. Chem. 65(4), 819–872 (1993).
- IUPAC, “hold-up volume (hold-up time), VM (tM)”, Compendium of Chemical Terminology (the “Gold Book”), online version, DOI 10.1351/goldbook.H02833; from L. S. Ettre, Pure Appl. Chem. 65, 819 (1993).
- J. P. Foley and J. G. Dorsey, “Equations for calculation of chromatographic figures of merit for ideal and skewed peaks”, Anal. Chem. 55(4), 730–737 (1983).
- United States Pharmacopeia, General Chapter ⟨621⟩ Chromatography, USP–NF, DOI 10.31003/USPNF_M99380_01_01.
- S. P. McCann, H. Rana, B. A. Handzo and N. H. Snow, “Go with the flow: thinking about carrier gas flow in GC”, LCGC North America 38(3) (March 2020).
- J. J. van Deemter, F. J. Zuiderweg and A. Klinkenberg, “Longitudinal diffusion and resistance to mass transfer as causes of nonideality in chromatography”, Chem. Eng. Sci. 5(6), 271–289 (1956).
- M. J. E. Golay, “Theory of chromatography in open and coated tubular columns with round and rectangular cross-sections”, in Gas Chromatography 1958 (D. H. Desty, ed.), Butterworths, London, pp. 36–55 (1958).
- L. S. Ettre, “M.J.E. Golay and the invention of open-tubular (capillary) columns”, J. High Resolut. Chromatogr. 10(5), 221–230 (1987).
- J. V. Hinshaw, “Frequently asked questions about hydrogen carrier gas”, LCGC Europe 22(1) (January 2009).
- K. Grob, Split and Splitless Injection for Quantitative Gas Chromatography: Concepts, Processes, Practical Guidelines, Sources of Error, 4th ed., Wiley-VCH (2001), DOI 10.1002/9783527612871.
- J. V. Hinshaw, “When good columns go bad”, LC•GC Europe 15(1), 2–5 (January 2002).
- C. English, “Understanding the origins of siloxane ghost peaks in gas chromatography”, The Column 18(6), 10–15 (2022).
- X. Hu, C. Li and J. Deng, “The origins, identification, and solutions for ghost peaks in gas chromatography”, Chromatographia 89(2), 121–133 (2026).
Further reading
- H. M. McNair, J. M. Miller and N. H. Snow, Basic Gas Chromatography, 3rd ed., Wiley (2019), DOI 10.1002/9781119450795.
- D. Rood, The Troubleshooting and Maintenance Guide for Gas Chromatographers, 4th ed., Wiley-VCH (2007) — ref. 1.
Reviewed against primary sources. Every equation, definition and threshold on this page is checked against the IUPAC Gold Book and the 1993 IUPAC recommendations on chromatographic nomenclature, the van Deemter (1956) and Golay (1958) plate-height treatments and the primary literature cited above; USP General Chapter ⟨621⟩ is cited for its peak-asymmetry convention and for the precedence of compendial criteria. Numerical examples are illustrative calculations from the equations stated and are not method-development predictions or acceptance criteria; the carrier-gas velocity ranges are quoted from one published Golay-plot example, not specifications. For validated or compendial methods, the applicable procedure and regulatory framework take precedence over the general rules of thumb given here. Evidence review: September 2026.