
HPLC LC/MS Troubleshooting
Chromatography troubleshooting is a key part of a chromatographer’s daily work. Here, we present articles and protocols to help a chromatorgher achieve this efficiently.
Ion Suppression and Matrix Effects in LC-MS/MS: Assessment, Diagnosis and Control
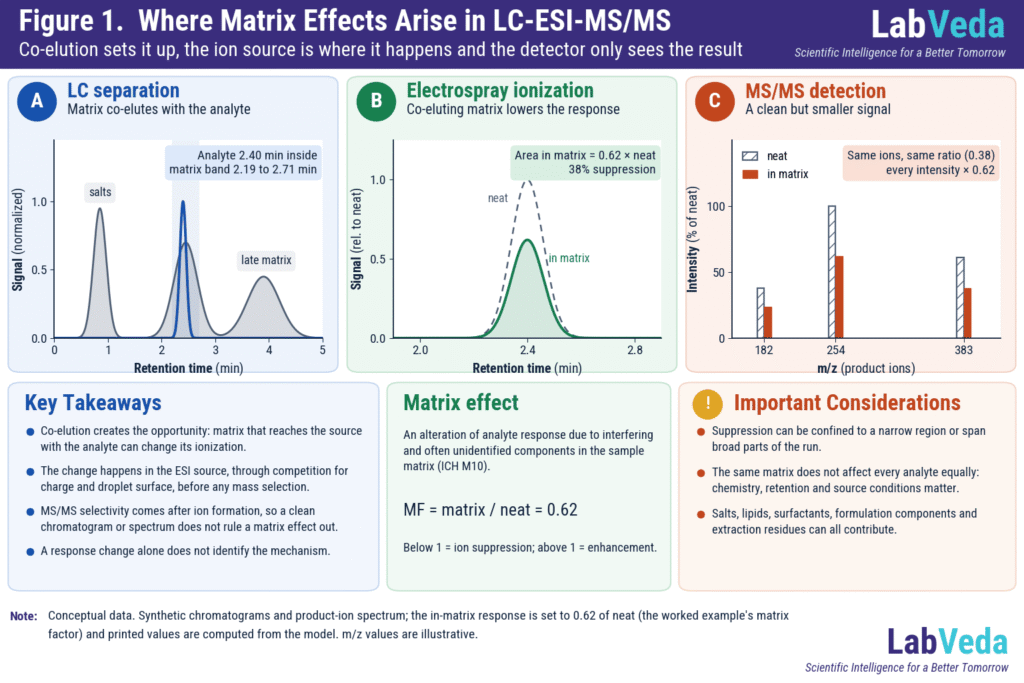
Ion suppression is a decrease in LC-MS/MS ionization response caused by matrix components that reach the ion source with the analyte. It is one form of matrix effect, which can also enhance response. A lower signal is not, by itself, proof of ion suppression: poor recovery, carryover, source contamination, drift, instability and chromatographic change look …
Ion Suppression and Matrix Effects in LC-MS/MS: Assessment, Diagnosis and Control Read More »
Sensitivity Loss During an LC-MS/MS Batch: How to Find the Cause
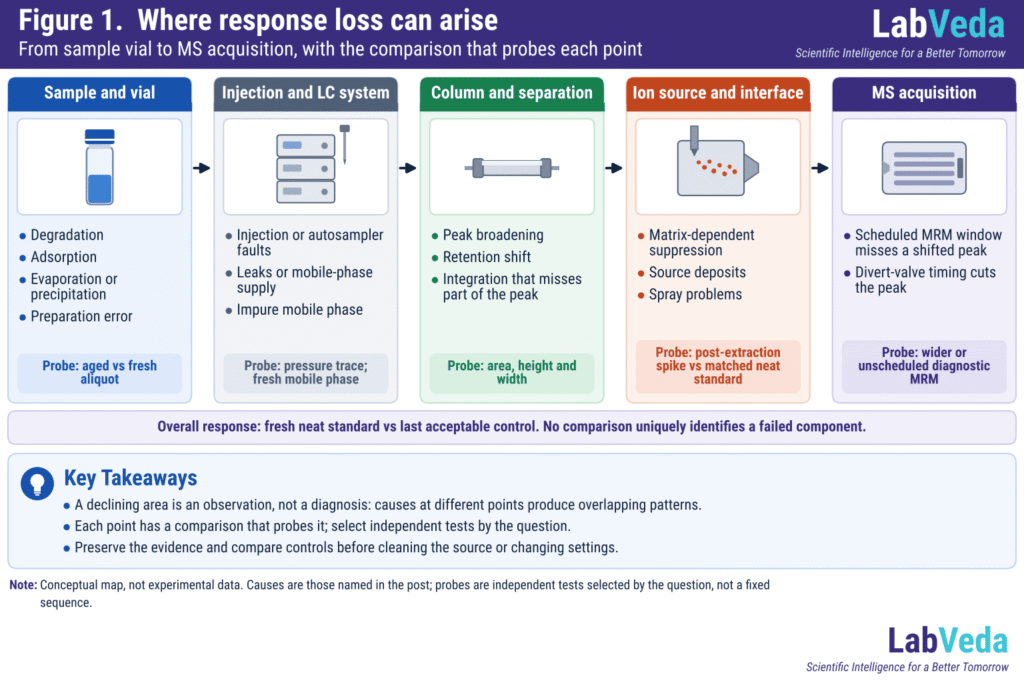
When LC-MS/MS response falls during a batch, compare repeated controls, absolute analyte and internal-standard (IS) areas, their ratio and chromatography, then select a test that separates system response from sample-dependent loss. A declining area is an observation, not a diagnosis: matrix effects, sample instability, injection problems and instrument changes can produce overlapping patterns. Manufacturer guidance …
Sensitivity Loss During an LC-MS/MS Batch: How to Find the Cause Read More »

Autosampler Carryover in HPLC and LC-MS: How to Find It and Wash It Out
Figure 1. Carryover across successive blank injections. Dilution carryover falls to near zero after the first blank; adsorptive carryover decays slowly and persists into later blanks. Carryover is one of the quietest ways an autosampler can wreck your data. A trace of analyte left behind from a previous injection shows up in the next one …
Autosampler Carryover in HPLC and LC-MS: How to Find It and Wash It Out Read More »

HPLC Baseline Noise and Drift: How to Tell Them Apart and Fix Each
Figure 1. Noise versus drift. Fast random jitter points to the detector or mobile phase; a slow directional shift points to temperature, gradient or column equilibration. An unstable baseline is one of the most common and most time-consuming problems in HPLC. Figure 1 contrasts the two. A wandering or fuzzy baseline masks low-level peaks, degrades …
HPLC Baseline Noise and Drift: How to Tell Them Apart and Fix Each Read More »

Ghost Peaks in HPLC: What Causes Them and How to Eliminate Them
Figure 1. Ghost peaks in a gradient blank. Sharp peaks elute as %B rises even though nothing was injected — contaminant concentrated on the column head during equilibration is released as the organic strength increases. You inject a blank — pure solvent, no sample — and peaks appear anyway. Figure 1 shows the classic pattern. …
Ghost Peaks in HPLC: What Causes Them and How to Eliminate Them Read More »

Why Your HPLC Peaks Are Tailing: Causes and a Diagnostic Path
Figure 1. Symmetric versus tailing peak. A symmetric peak sits near As 1.0; the tailing peak shows the slow trailing edge produced by secondary interactions. Peak tailing is one of the most common complaints in HPLC — and one of the most misdiagnosed. Figure 1 contrasts a symmetric peak with a tailing one. A tailing …
Why Your HPLC Peaks Are Tailing: Causes and a Diagnostic Path Read More »

High Backpressure in HPLC: 8 Root Causes and How to Diagnose Each One
Figure 1. The HPLC flow path. Disconnecting components in sequence from the detector back towards the pump localises the restriction. High system backpressure is one of the most common — and most disruptive — problems in liquid chromatography. Figure 1 shows the flow path you will be working along. It interrupts runs, triggers pump shutoffs, …
High Backpressure in HPLC: 8 Root Causes and How to Diagnose Each One Read More »
Understanding Size Exclusion Chromatography Techniques
If you’re delving into the world of chromatography, you might have come across a technique called size exclusion chromatography (SEC). This method is essential for separating molecules based on their size, and it plays a crucial role in various scientific fields. In this article, we’ll explore everything you need to know about size exclusion chromatography, …
Understanding Size Exclusion Chromatography Techniques Read More »
Understanding RF Values in Chromatography Techniques
The retardation factor, RF, is the migration coordinate used in planar chromatography. In TLC, HPTLC and paper chromatography it expresses how far the centre of an analyte zone travels relative to the mobile-phase front, under one defined set of conditions. RF is not an intrinsic property of a compound. It is a property of the …
Understanding RF Values in Chromatography Techniques Read More »