HPLC LC/MS Troubleshooting

Chromatography troubleshooting is a key part of a chromatographer’s daily work. Here, we present articles and protocols to help a chromatorgher achieve this efficiently.

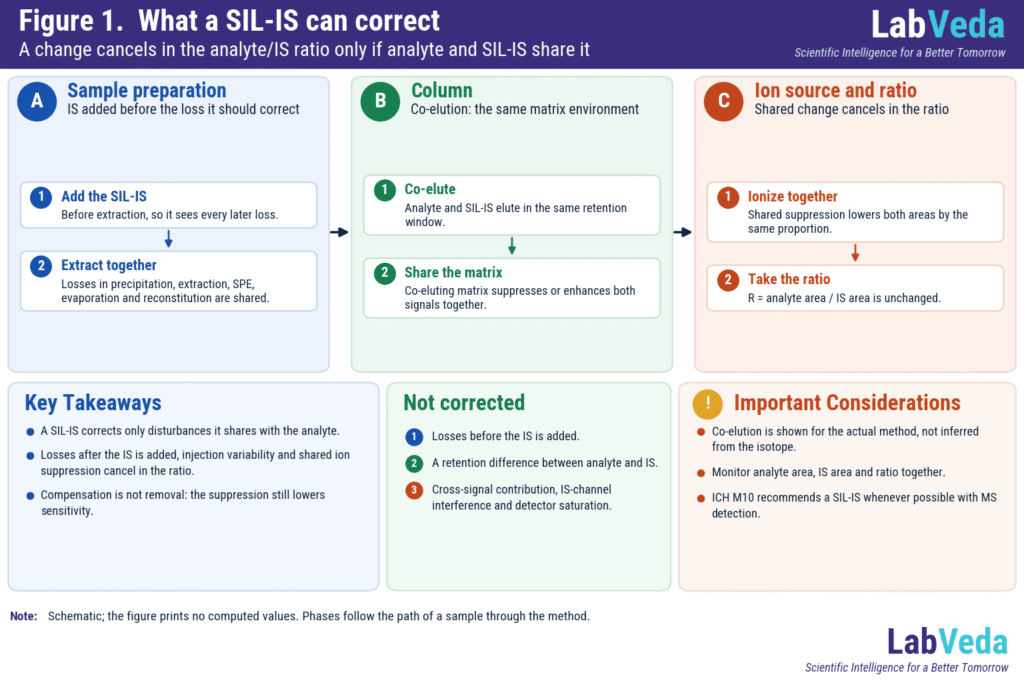
Stable isotope labeled internal standard in LC-MS/MS: analyte and SIL-IS pass together through sample preparation, the column and the ion source, so shared extraction loss, injection variability and ion suppression cancel in the analyte/IS ratio.

Stable Isotope Labeled Internal Standards in LC-MS/MS: What They Correct and What They Don’t

A stable isotope labeled internal standard (SIL-IS) corrects LC-MS/MS results only for disturbances it shares with the analyte. Extraction losses that happen after it is added, injection variability and ion suppression in a shared retention window cancel in the analyte/IS ratio. Losses before it is added, retention differences, cross-signal contribution, IS-channel interference and detector saturation …
Stable Isotope Labeled Internal Standards in LC-MS/MS: What They Correct and What They Don’t Read More »

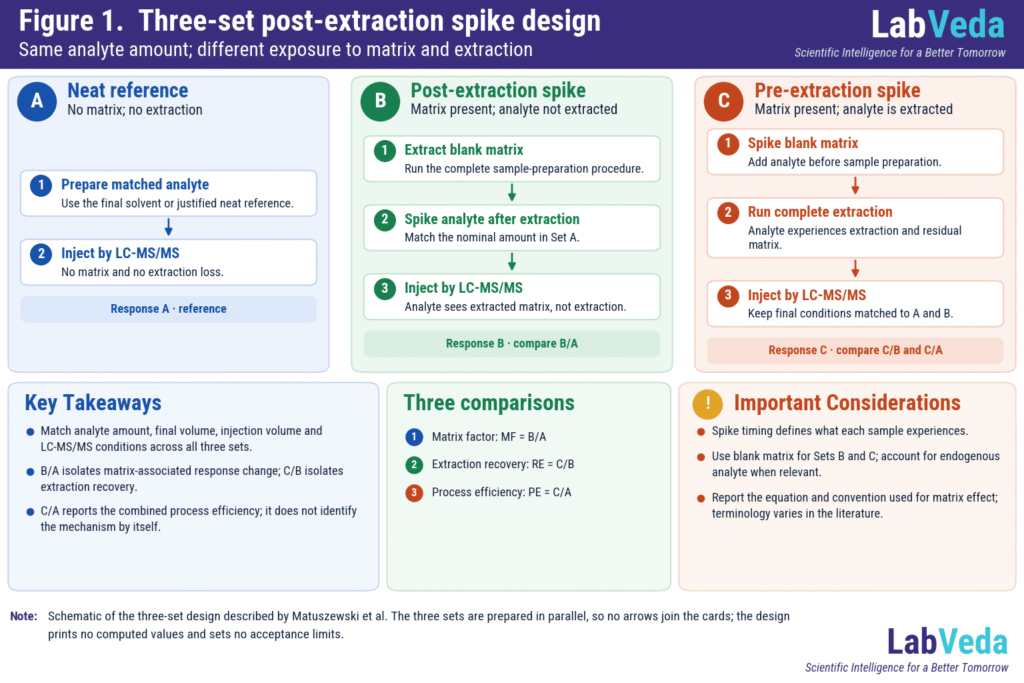
Post-extraction spike three-set design for LC-MS/MS: neat reference A, post-extraction spike B and pre-extraction spike C, compared as matrix factor B/A, extraction recovery C/B and process efficiency C/A.

Post-Extraction Spike in LC-MS/MS: Matrix Factor, Recovery and Process Efficiency

A post-extraction spike experiment measures how much co-eluting matrix changes LC-MS/MS response, separately from how much analyte the sample preparation loses. Three matched preparations – a neat reference, extracted blank matrix spiked after extraction and matrix spiked before extraction – give the matrix factor, extraction recovery and process efficiency. It is the quantitative half of …

Post-Extraction Spike in LC-MS/MS: Matrix Factor, Recovery and Process Efficiency Read More »

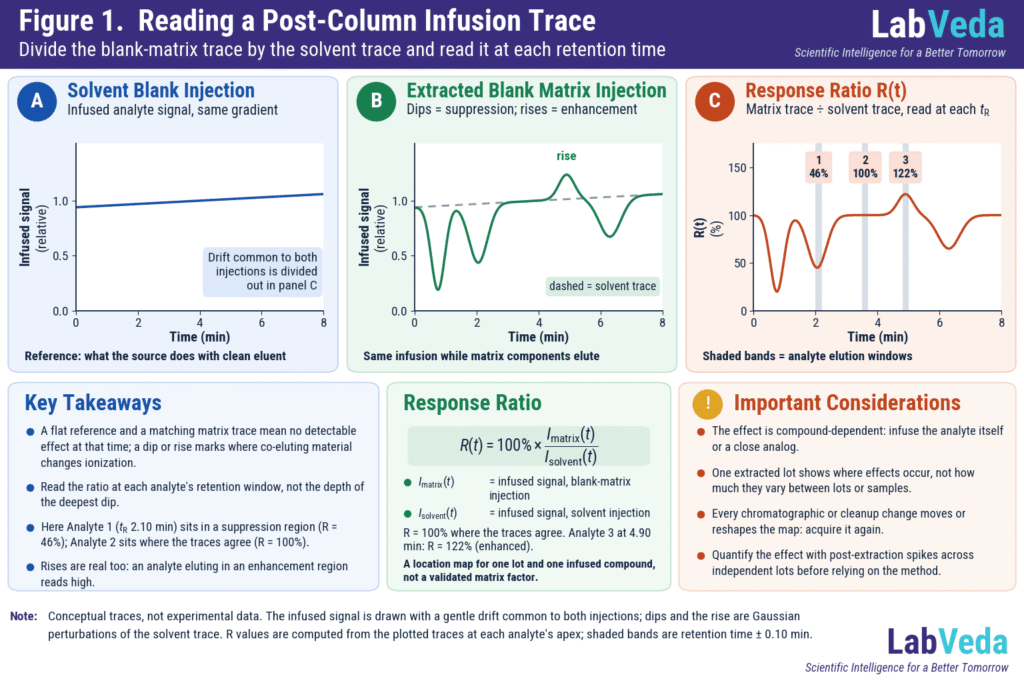
Three-panel LC-MS post-column infusion infographic: the infused analyte signal during a solvent-blank injection is nearly flat; during an extracted blank matrix injection it dips in three regions and rises in one; the ratio trace reads 46% at 2.10 min (suppressed), 100% at 3.60 min (no clear effect) and 122% at 4.90 min (enhanced).

Post-Column Infusion for LC-MS Matrix-Effect Diagnosis: Setup, Interpretation and Limits

Post-column infusion is a qualitative LC-MS experiment that shows where in a chromatographic run co-eluting matrix components suppress or enhance ionization. A constant stream of analyte is teed into the column effluent while an extracted blank matrix is injected, and dips or rises in the otherwise steady signal mark the affected retention times. It is …

Post-Column Infusion for LC-MS Matrix-Effect Diagnosis: Setup, Interpretation and Limits Read More »

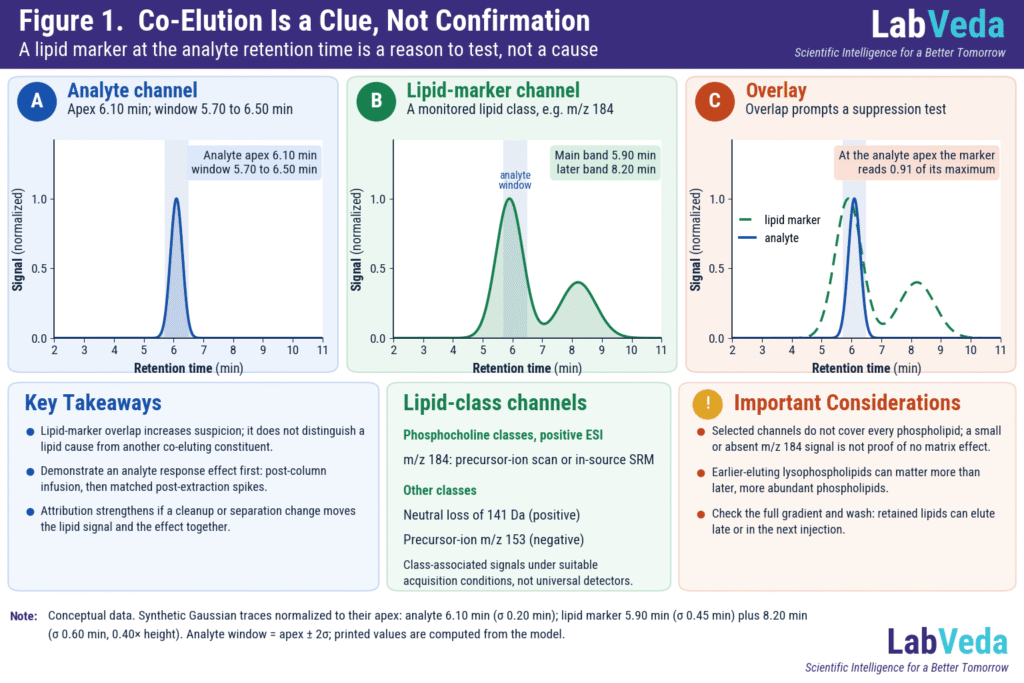
Three panels: an analyte peak at 6.10 min with its window 5.70 to 6.50 min shaded; a lipid-marker trace with its main peak at 5.90 min and a smaller peak at 8.20 min; and the two overlaid, where the lipid marker is at 0.91 of its maximum at the analyte apex. The overlap prompts an ion suppression test; it does not prove one.

Phospholipid Interference in LC-MS/MS: How to Detect, Remove and Control It

Phospholipid interference in LC-MS/MS happens when phospholipids carried through sample preparation co-elute with an analyte and change its ionization. In a quantitative assay this can shift analyte and internal-standard responses, widen lot-to-lot variability or bias results. A phospholipid marker at the analyte retention time is a clue; it does not establish the cause. Locate the …

Phospholipid Interference in LC-MS/MS: How to Detect, Remove and Control It Read More »

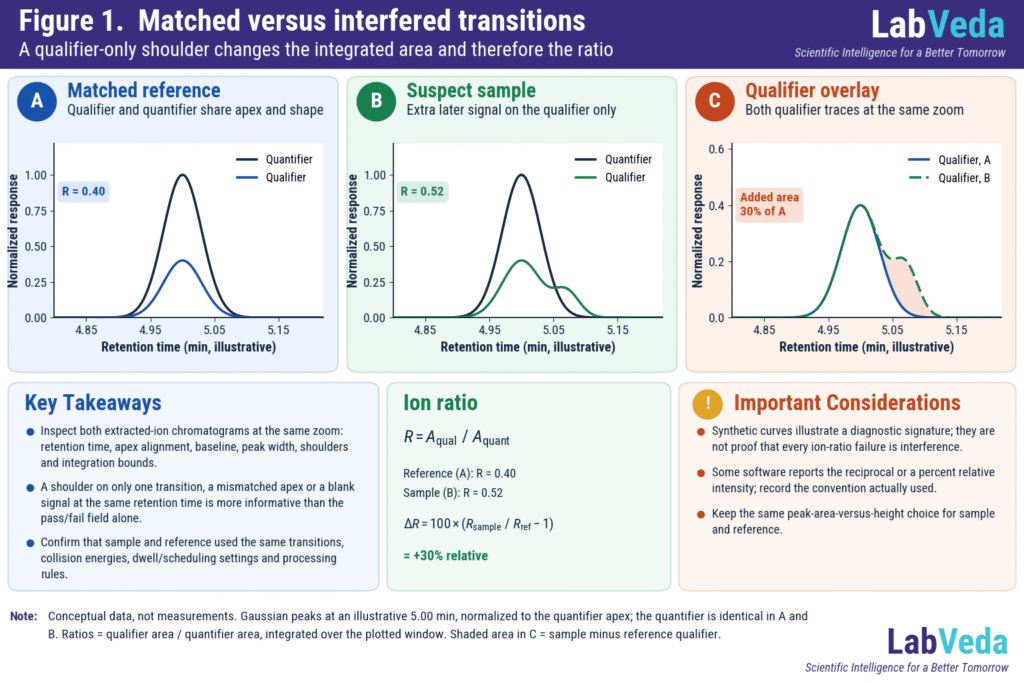
Three synthetic LC-MS/MS MRM chromatogram panels for an ion ratio check: in the matched reference the quantifier and qualifier peaks share an apex at 5.0 min (ratio 0.40); in the suspect sample the qualifier trace carries a later-eluting shoulder that changes its integrated area (ratio 0.52); an overlay of the two qualifier traces shades the added area, 30% of the reference qualifier.

Why Does My LC-MS/MS Qualifier/Quantifier Ion Ratio Fail?

A failed qualifier/quantifier ion ratio means the relative responses of two monitored transitions differ from an appropriate reference. The deviation can reveal a false identification or a biased quantifier, but low qualifier signal and data-processing choices can also make a real analyte fail. The acceptance rule depends on the method and its regulatory scope; there …

Why Does My LC-MS/MS Qualifier/Quantifier Ion Ratio Fail? Read More »

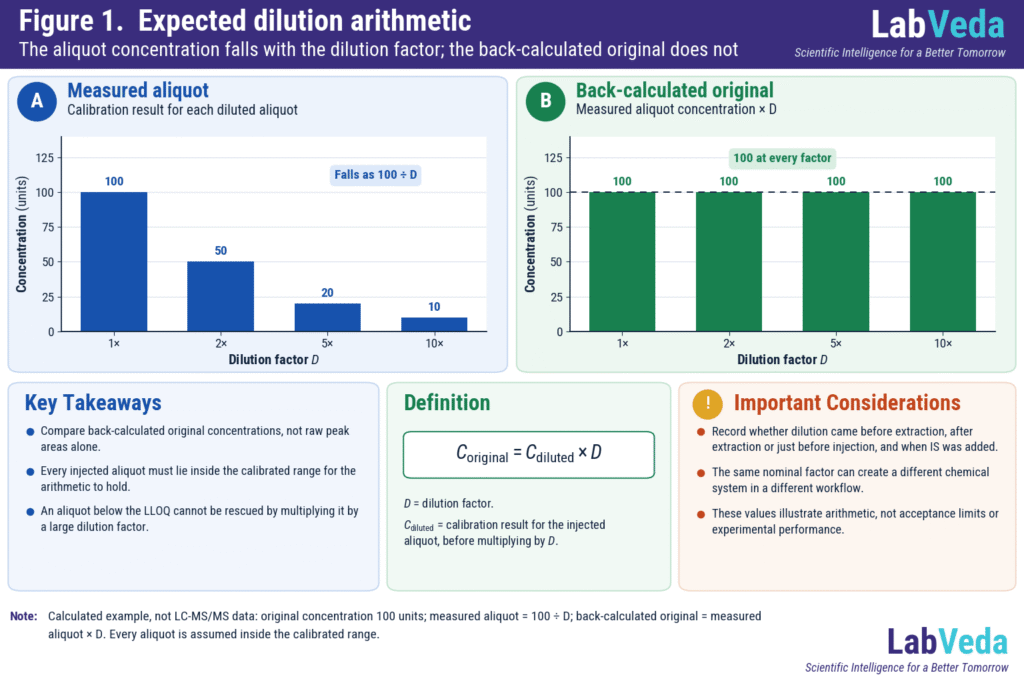
Bar chart of expected dilution arithmetic: measured aliquot concentration falls to 50, 20 and 10 units at 2x, 5x and 10x dilution while the dilution-corrected original estimate stays at 100 units across all factors.

Why Does My LC-MS/MS Result Change After Dilution?

If the concentration you calculate for the original sample changes with the dilution factor, the result is a pattern, not yet a cause. Before altering the method, verify the dilution arithmetic and confirm that every injected aliquot lies inside the calibrated range. Then compare matrix-matched dilution QCs, neat controls, analyte and internal-standard (IS) responses, and …

Why Does My LC-MS/MS Result Change After Dilution? Read More »

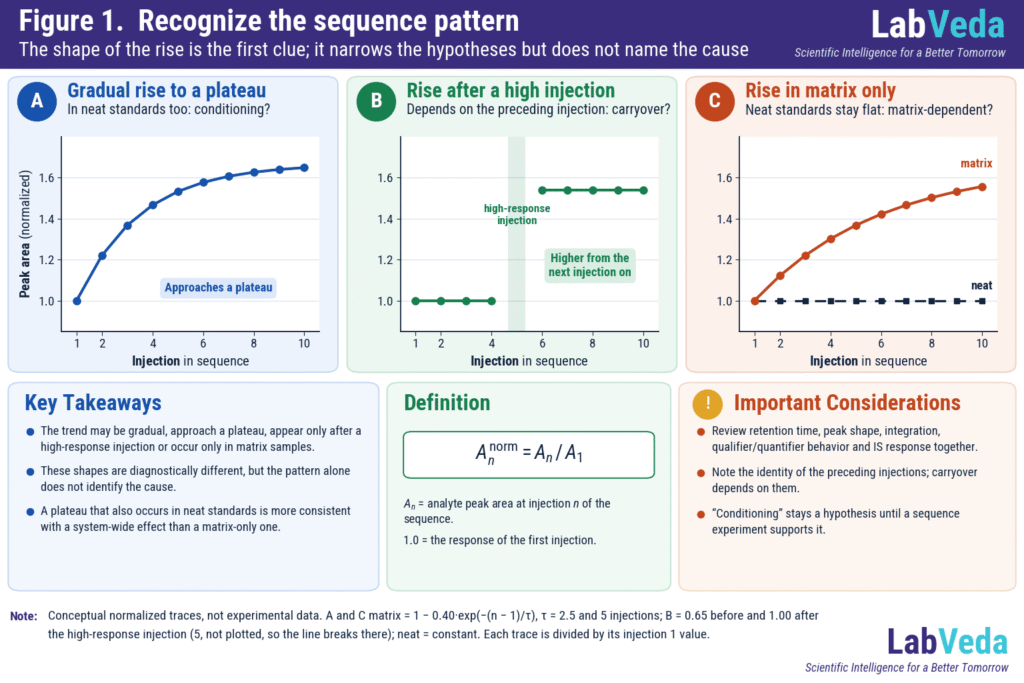
Three conceptual plots of normalized peak area across a ten-injection sequence: A a gradual rise that approaches a plateau, labeled system or source conditioning; B a step rise after a high-response injection, labeled carryover; and C a rise in extracted matrix samples while neat standards stay flat, labeled matrix-dependent.

Why Are My LC-MS Peak Areas Increasing Across a Sequence? Causes, Diagnosis and Corrective Actions

An LC-MS/MS peak area that climbs across an injection sequence is a pattern, not a diagnosis. The rise can come from the analyte, sample preparation, the matrix, the flow path, the ion source, detector response, or the relationship between one injection and the next. The fast route to the cause is to characterize the trend, …

Why Are My LC-MS Peak Areas Increasing Across a Sequence? Causes, Diagnosis and Corrective Actions Read More »

Scroll to Top